Figure 3.

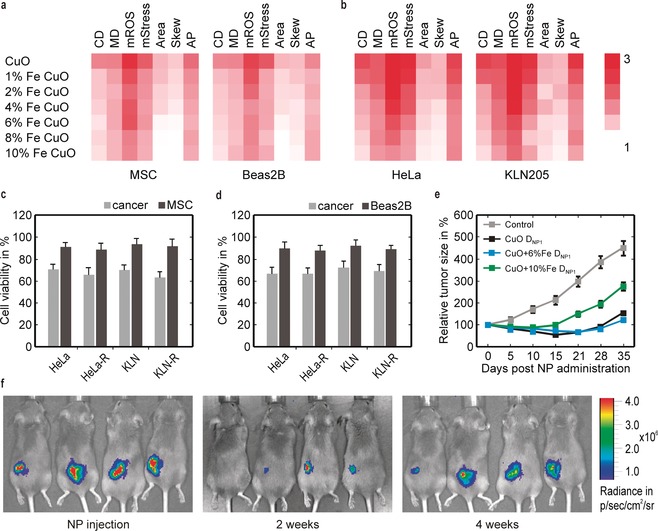
Therapeutic efficacy of Fe‐doped CuO NPs against different cancer types. a,b) High content imaging data for the indicated cell types exposed to the different NPs at 12.5 μg mL−1. The fold‐difference compared to untreated control cells is indicated in color‐code for CD=cell death, MD=membrane damage, mROS=mitochondrial ROS, mStress=mitochondrial stress, Area=cell size, Skew=cell skewness, and AP=autophagy. Histograms presenting the cellular parameters indicated for both normal cells and cancer cells (both wild‐type and resistant) grown in co‐culture experiments for c) MSC and d) Beas2B cells and exposed to 6 % Fe‐doped CuO at 12.5 μg mL−1. e) Relative luminescence signals for firefly luciferase‐expressing KLN 205 cells grafted subcutaneously in syngeneic DBA/2 mice and treated with CuO, 6 % Fe‐doped CuO, 10 % Fe‐doped CuO given at D NP1=125 μg/mouse. f) Representative luminescence images of DBA/2 mice bearing firefly luciferase‐expressing KLN 205 cells treated with 6 % Fe‐doped CuO (D NP3=225 μg/mouse), 0 (left), 2 (middle), and 4 weeks (right) after NP injection. The data are presented as mean ±SD (number of animals n=8).
