Figure 1.

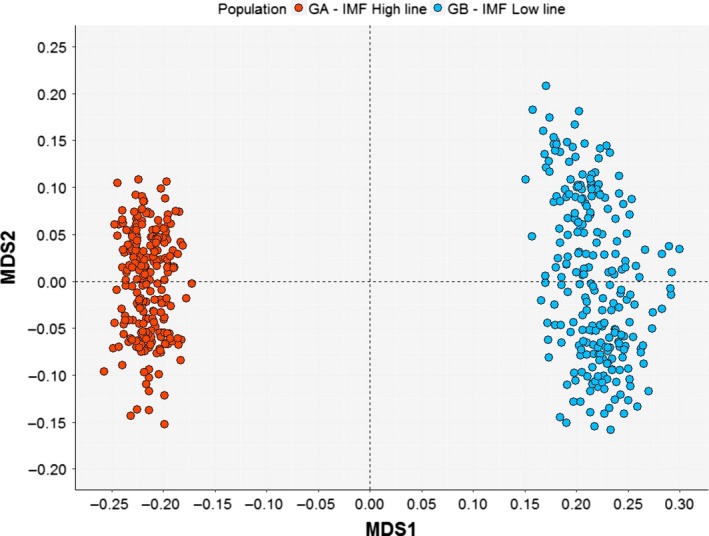
Multidimensional scaling plot of genomic data. The first component (MDS1) explained 29.26% of the genomic variance and the second component (MDS2) explained 3.26% of the genomic variance.

Multidimensional scaling plot of genomic data. The first component (MDS1) explained 29.26% of the genomic variance and the second component (MDS2) explained 3.26% of the genomic variance.