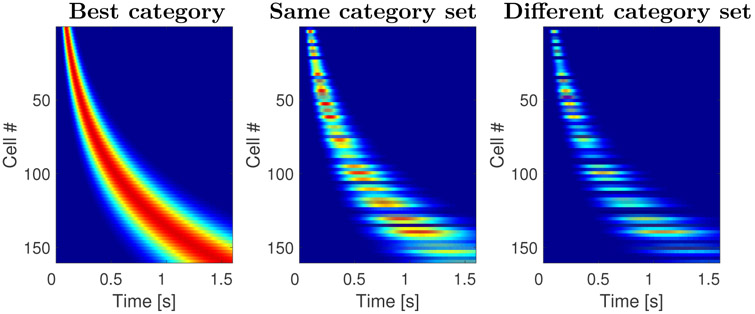
Figure 11. Sequentially activated time cells generated with the computational model.
The three plots on the figure resemble the results shown on Figure 8. Analogous to the heatmaps in Figure 8, each row corresponds to a single model unit and displays its normalized activity across time. The cells are sorted with respect to the peak time. The two features observed in Figure 8 are fully captured by the model: the time fields later in the delay were more broad than the time fields earlier in the delay and the density of time fields decreased as a function of time. This illustrates that the model can indeed account for the firing dynamics of the sequentially activated time cells that form a compressed representation of time. In addition, the model predicts that the stimulus selectivity observed in the data. This is because every time a stimulus is presented, it activates not only its own memory representation, but also the memory representation of other stimuli to the degree they are similar to the presented stimulus. The response to stimuli from the same category set is on average more similar the response to stimuli from different category sets.

