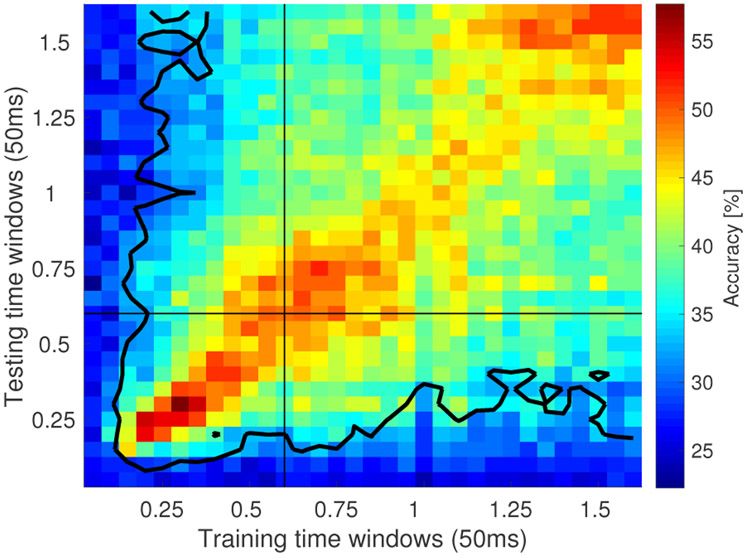
Figure 12. Decoding category identity using linear discriminant analysis (LDA) reveals gradual change of the population code across time.
The heatmap displays the accuracy of the LDA classified applied on 50 ms time bins. Each bin provides classification accuracy for the classifier trained on a bin denoted on x-axis and tested on a bin denoted on y-axis. Each bin is computed by averaging across 10 runs in which training and test trials were randomly chosen (80% of trials were used for training with 20% of trials held out for testing). The contour encloses bins where classification accuracy averaged over the 10 runs exceeded the Type I error rate at the .05 level.

