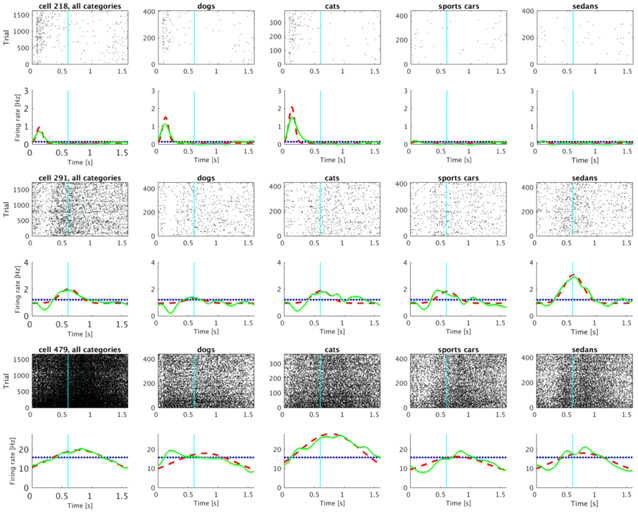
Figure 6. Representative time cells that were modulated by the category of the sample stimulus.
A significant proportion of units classified as time cells distinguished the categories from one another. The activity of three category-specific time cells is shown (rows) with rasters corresponding to all the trials (left) as well as to each of the four stimulus categories (subsequent four columns). Category 1 and 2 are trials in which the sample stimulus was chosen from the dog or cat category respectively; Category 3 and 4 are sports car and sedan trials. Averaged trial activity is shown as a solid green line, the model fit with only a constant term is given by the dotted blue line and the best-fitting model—with different coefficients for each category—as a dashed red line.

