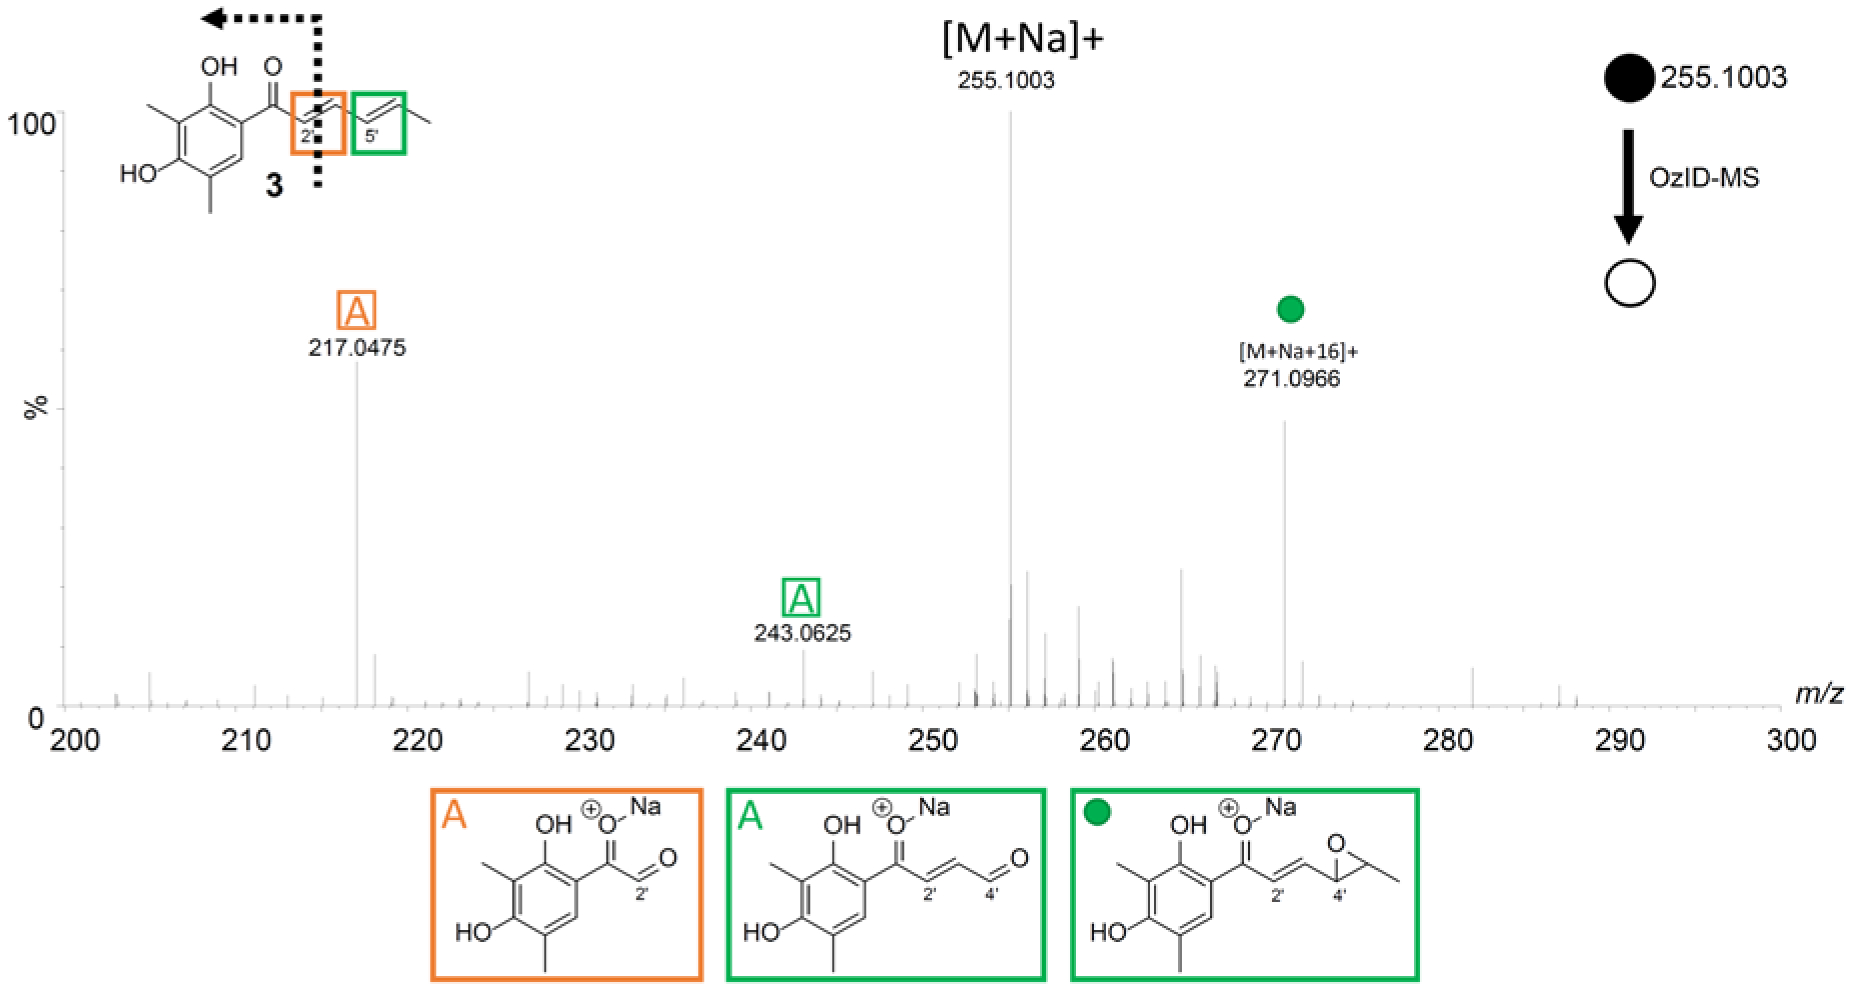
Figure 5.

The OzID-MS spectrum of 3 after targeted OzID fragmentation. The structure of 3 is shown on the top left. The green and orange boxes around the double bonds indicate positions where ozonolysis occurred. The informative OzID fragments are labeled with the colors corresponding to the structure, analogous to those in Figure 3. The OzID-MS products (shown under spectrum) are color and letter coded to represent the double bond that was cleaved, and these data are tabulated in Supporting Information Table S6.
