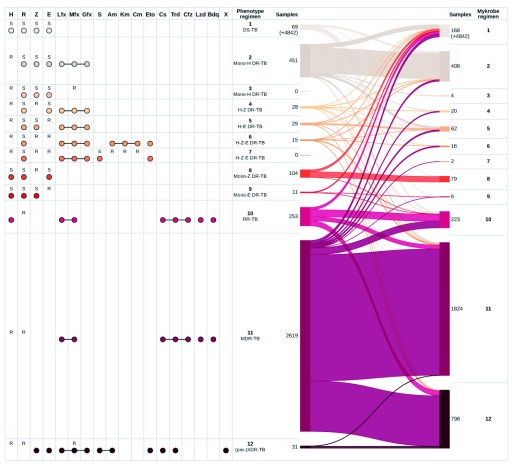
Figure 6. Comparison of drug regimen calls inferred from phenotype information and Mykrobe results, on the global and prospective datasets combined.
See supplementary files regimen_plot.global.pdf, regimen_plot.prospective.pdf for the same plot for each of the global and prospective sets separately. On the left, “R” and “S” show the drug phenotypes used to identify the regimen. For example, resistance to isoniazid and moxifloxacin, and susceptibility to rifampicin, pyrazinamide and ethambutol implies drug regimen 3. Coloured dots show the drugs that are included in the regimen, where a line joining drugs represents interchangeability. The ribbons on the right show the mapping of phenotype-inferred regimens (left) to Mykrobe-inferred regimens (right), with numbers showing the number of samples allocated to each regimen. 4,842 samples called as regimen 1 by both methods are not shown. H, isoniazid; R, rifampicin; Z, pyrazinamide; E, ethambutol; Lfx, levofloxacin; Mfx, moxifloxacin; Gfx, gatifloxacin; S, streptomycin; Am, amikacin; Km, kanamycin; Cm, capreomycin; Eto, ethionamide; Cs, cycloserine; Trd, terizidone; Cfz, clofazimine; Lzd, linezolid; Bdq, bedaquiline; X, other WHO second-line drugs to which isolate is shown to be susceptible.

