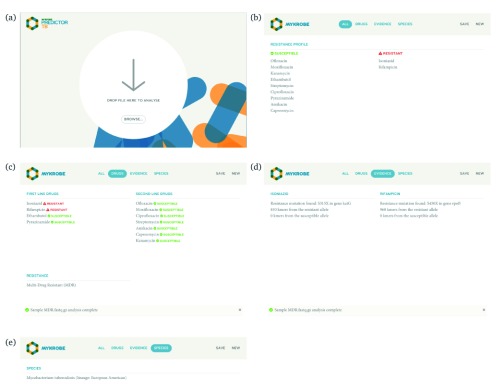
Figure 7.
( a) Start page of the Mykrobe application. Users can drag-and-drop or select their sequence files. Once selected, Mykrobe starts the analysis process. ( b) Once the analysis is complete, the user is shown the resistance profile - which drugs is the isolate predicted to be resistant to, and susceptible to. ( c) Resistance profile can be broken down into first and second line drugs. ( d) The identified genetic substrate for resistance prediction can be seen in the "Evidence" tab. Here, evidence for isoniazid and rifampicin resistance is observed in variants KatG position 315 and rpoB position 450, respectively. ( e) The species and lineage prediction can be seen in the "Species" tab. Here the sample is Mycobacterium tuberculosis of European/American lineage.

