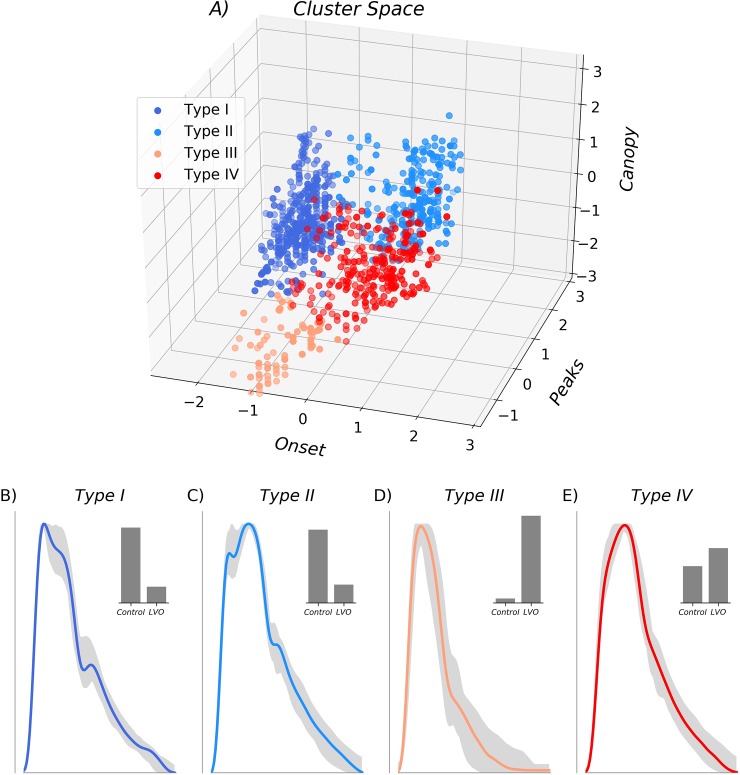
Fig 3. Cluster feature space.
Three-dimensional feature space is shown in Z-scored coordinates with the optimal four clusters indicated by color. Associated cluster morphologies are shown for each beat type (B-E), with each cluster archetype shown in color, and the range of the next 50 most representative exemplars depicted in gray. Associated histograms in the upper right (B-E) demonstrate that Type I and II clusters were primarily composed of waveforms from control patient populations, whereas Type III and IV clusters were primarily composed of LVO patient waveforms.

