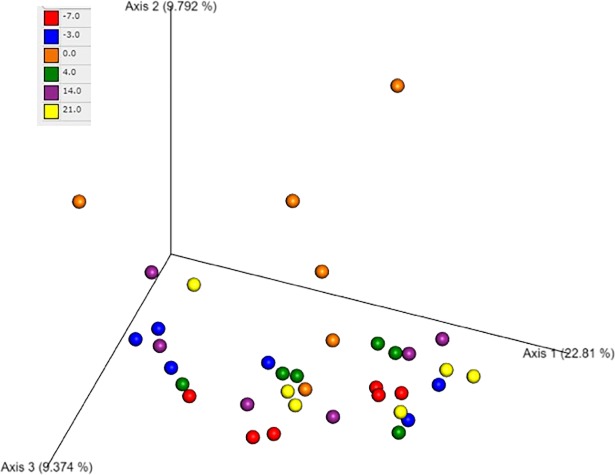
Fig 8. Principal coordinates analysis (PCoA) of microbial communities from the fecal samples of dogs after administration of oral febantel combined with pyrantel and praziquantel.
The figure shows a 3D PCoA plot based on unweighted UniFrac distances of 16S rRNA genes. Each of the days is represented by a different color. There is no clustering of dogs by time point.

