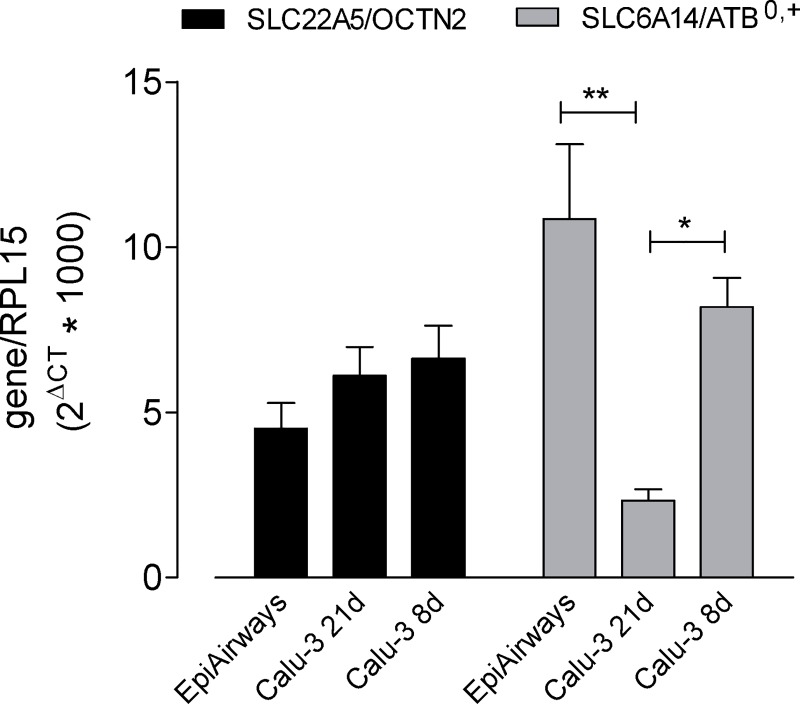
Fig 3. Expression of SLC22A5/OCTN2 and SLC6A14/ATB0,+ in EpiArway™ and Calu-3 cells.
mRNA levels were determined in EpiAirway™ and in Calu-3 cultured under ALI conditions for 8d or 21d, as indicated, by means of RT-qPCR analysis. The expression of the gene of interest was shown after normalization for that of the reference gene (RPL15). Data are means ± SEM of five independent experiments. *p<0.05, **p<0.01. Original data are available at osf.io (DOI 10.17605/OSF.IO/Z3UB5).

