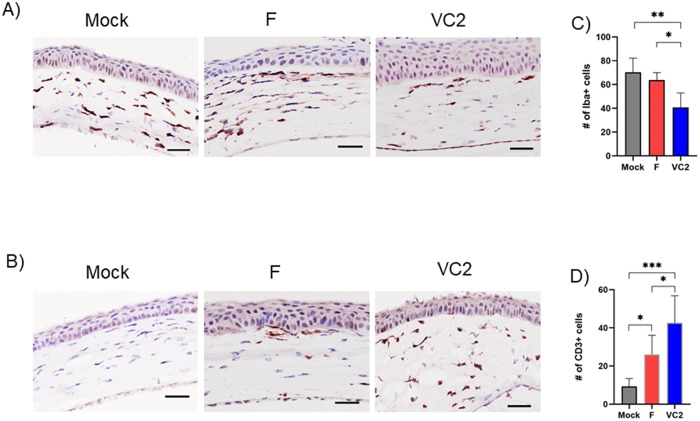
Fig 6. Characterization of immune cell infiltration in corneal stroma.
(A) Corneal sections from 3 days post challenge were stained with (A) Iba1 for macrophage, and (B) CD3 for T lymphocytes. Quantification of (C) Iba1-positive macrophages, and (D) CD3-positive T cells in corneal tissue sections was performed from 10 different regions of cornea stroma per eye (n = 6). Statistical analysis was done using One-Way ANOVA and Tukey-Kramer test. *P ≤ 0.05 **P ≤ 0.01, ***P ≤ 0.001.

