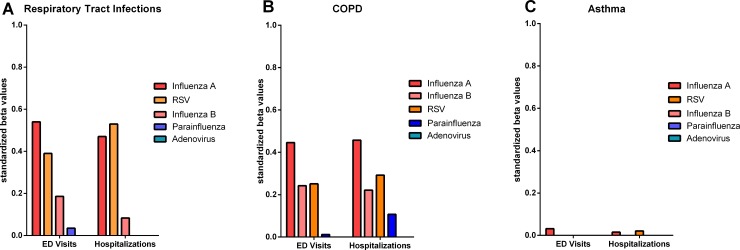
Fig 3.
Contribution of individual viruses to the variability in ED visits and hospitalizations with RTIs (A), COPD (B) and Asthma (C) for 5 viruses over an 11-year period (Period A). Values on y-axis represent the standardized beta values. Where there was no contribution of virus at reducing the variability in a multivariate model, a value of 0 was assigned.

