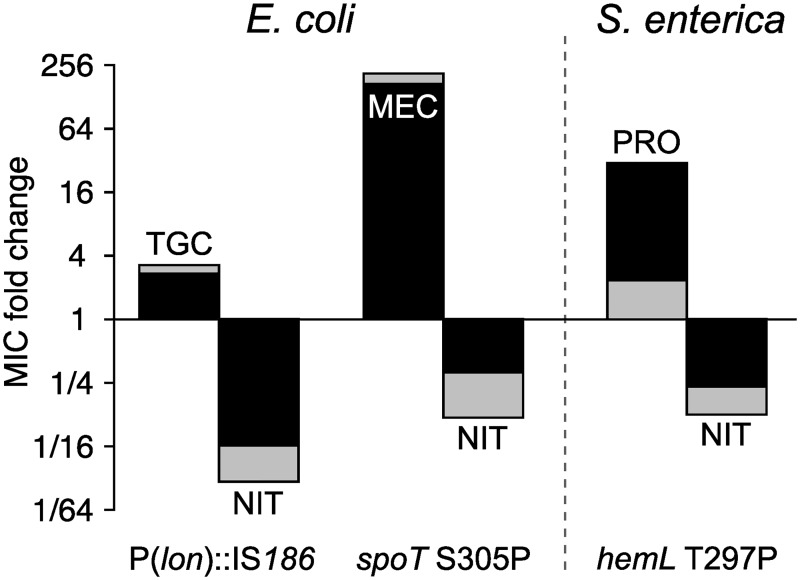
Fig 1. NIT CS.
Three single-step mutants with resistance against 3 diverse antibiotics (upward bars) show CS to NIT (downward bars). Fold change of the MIC compared to susceptible wild-type strains. Light shading denotes an inoculum of 106 cells; the overlaid dark shading corresponds to a larger inoculum of 108 cells. Numerical data are available in S1 Data. CS, collateral sensitivity; MEC, mecillinam; MIC, minimum inhibitory concentration; NIT, nitrofurantoin; PRO, protamine sulfate; TGC, tigecycline.

