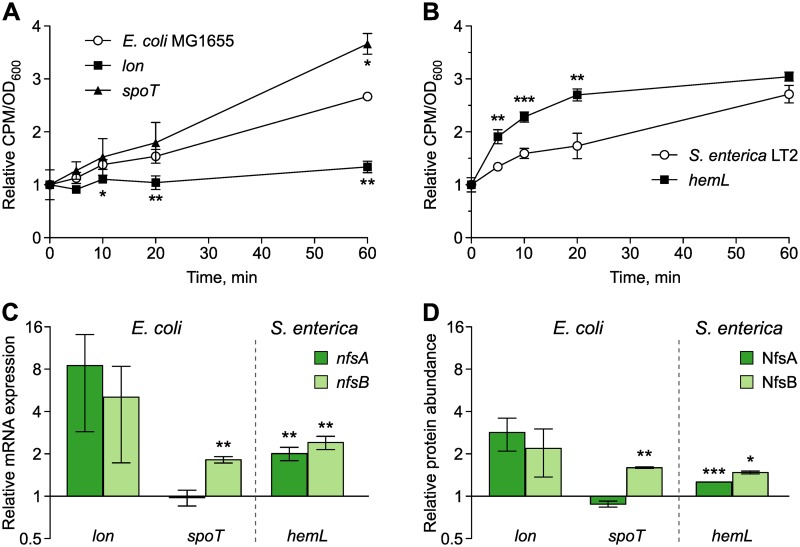
Fig 2. Mechanisms of CS to NIT.
Uptake dynamics of radioactively labelled NIT measured as CPM in washed cell pellets of E. coli (A) and S. enterica (B). Measurements are normalized by the OD600 of the sample and expressed relative to the first measurement (n = 3 biological replicates). (C) mRNA expression of nfsA and nfsB relative to wild-type strains of E. coli and S. enterica measured with qRT-PCR (mean ± SD, n = 3 biological replicates). (D) Relative abundance of the proteins NfsA and NfsB measured with mass spectrometry (mean ± SD, n = 2 biological replicates). Student t test, ***P < 0.001, **P < 0.01, *P < 0.05. The numerical data for this figure and the full proteomic data sets are available in S1 Data. CPM, counts per minute; CS, collateral sensitivity; NIT, nitrofurantoin; OD600, optical density at 600 nm; qRT-PCR, quantitative reverse transcription PCR.

