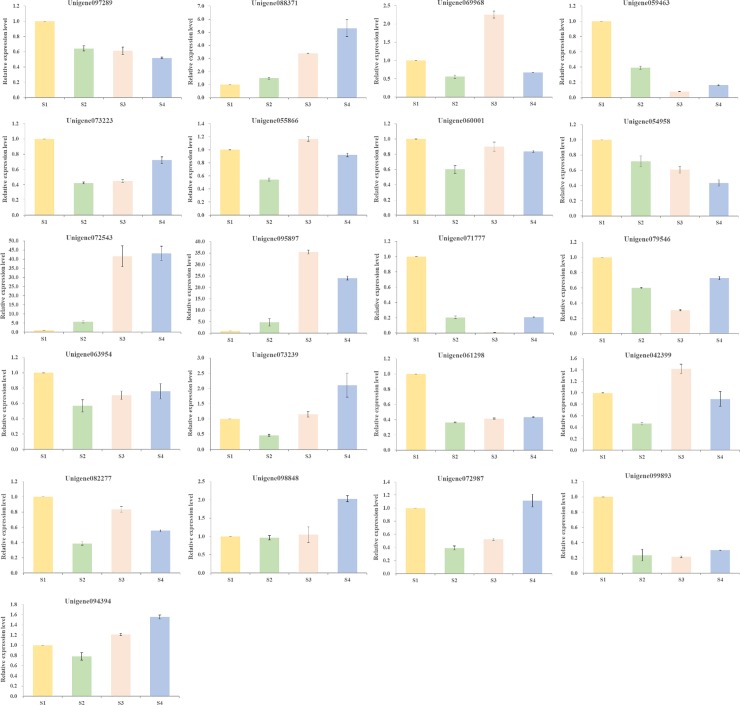
Fig 14. qRT-PCR quantification of the relative expression of unigenes encoding target proteins from C. oleifera seeds at four different developmental stages.
To determine relative fold differences for the unigenes involved in lipid metabolism, their Ct values were normalized to the Ct value for Actin gene (GAPDH). The gene expression levels of S1 were set to 1, and relative expression levels were calculated relative to a calibrator using the formula 2-ΔΔCt. The detailed results for these unigenes are listed in S10 Table.

