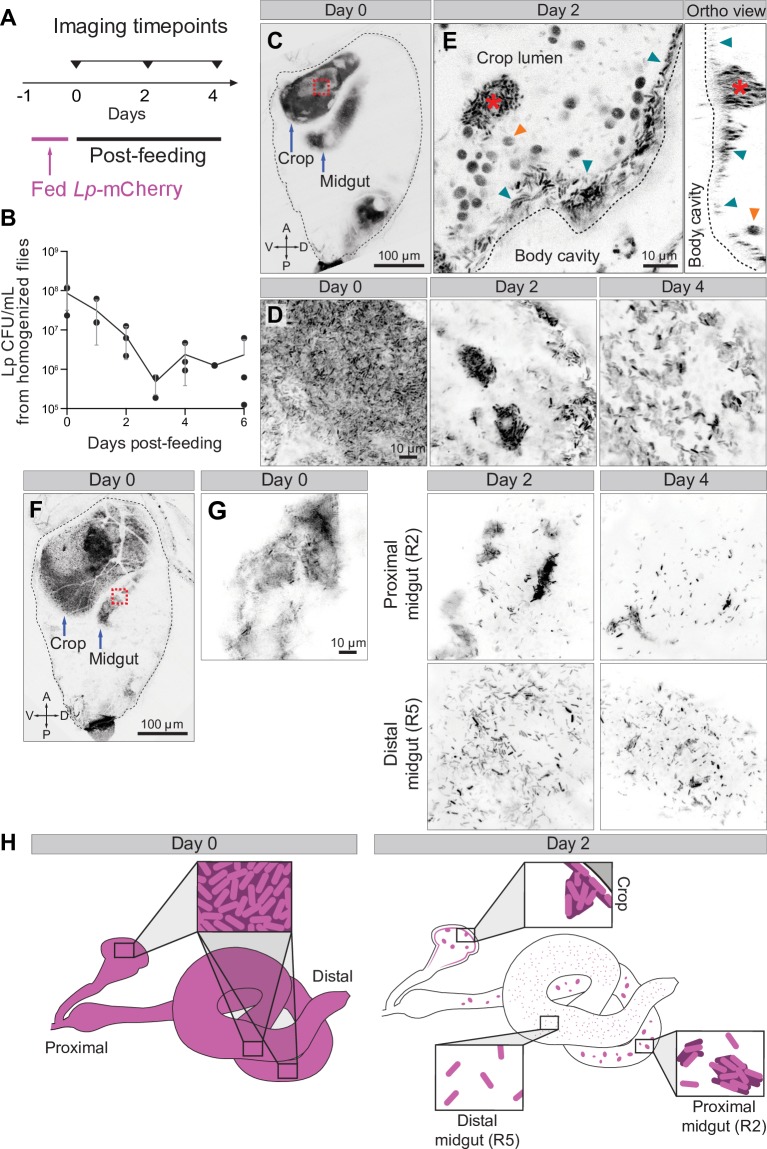
Fig 4. Serial imaging reveals regional dynamics of gut bacterial colonization.
(A) Time points for serial imaging of gut colonization by L. plantarum. Animals were administered a 1-day pulse of L. plantarum-mCherry. L. plantarum was removed, and individual animals were imaged as indicated. The first imaging session is designated day 0. (B) Whole-animal CFUs following a 1-day pulse of L. plantarum-mCherry. Single flies were homogenized at the indicated times, and L. plantarum CFUs were measured. Each point represents CFUs from one animal. CFUs plateaued at 3 days, indicating stable colonization. The data underlying this figure are included in S2 Data. (C–E) Longitudinal imaging of L. plantarum in the crop of a single animal. (C) Whole abdomen on day 0. L. plantarum-mCherry (inverted grayscale) filled the crop and midgut. The boxed region is shown as a close-up in D. (D) Time series of L. plantarum in the crop of the animal in C. The distribution of L. plantarum was initially dense and became sparser over time. (E) Detailed images of crop from day 2. Sagittal (left) and orthogonal (right) sections are shown. L. plantarum accumulated along the crop’s inner wall (blue arrows) and formed prominent clumps (red asterisk). Ingested yeast cells (orange arrows) were also visible due to autofluorescence. See S8 Movie. (F–G) Longitudinal imaging of L. plantarum in the midgut of a single animal. (F) Whole abdomen on day 0. Inverted grayscale, L. plantarum-mCherry. Boxed region is shown as a close-up in G. (G) Time series of L. plantarum in midgut of animal in F. Only one midgut loop was visible on day 0; 2 loops (proximal/R2 and distal/R5; see S7 Fig) were visible on days 2 and 4. Over time, L. plantarum became clumped in the lumen of the proximal/R2 loop and individually dispersed in the lumen of the distal/R5 loop. See S6 Fig and S9 and S10 Movies. (H) Heterogenous dynamics of L. plantarum colonization and dispersal in distinct gut regions. Crop, proximal/R2 midgut, and distal/R5 midgut each exhibited distinct spatial patterns of bacterial localization over time. Genotype for all panels: ubi-his2avD::YFP. Images in C–F are single optical sections. Images in G are maximum projections of confocal stacks. CFU, colony-forming unit; his2av, histone variant His2av; Lp, L. plantarum; YFP, yellow fluorescent protein.

