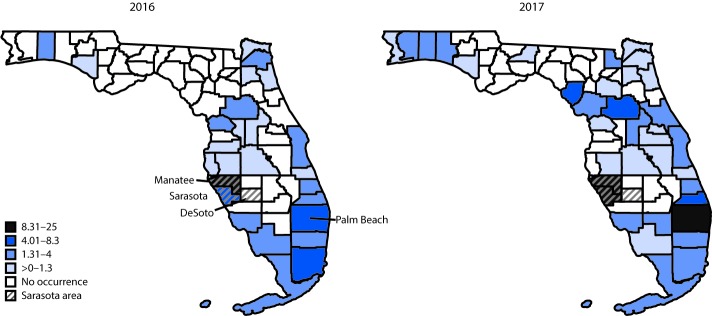
FIGURE 2.
Carfentanil-involved deaths per 100,000 population,* by county where death occurred — Florida, 2016 and 2017†
* Most rates are based on counts <20 and should be interpreted with caution.
† Cutpoints for rate categories (based on 2016) determined using Jenks Natural Breaks Optimization in ArcGIS.

