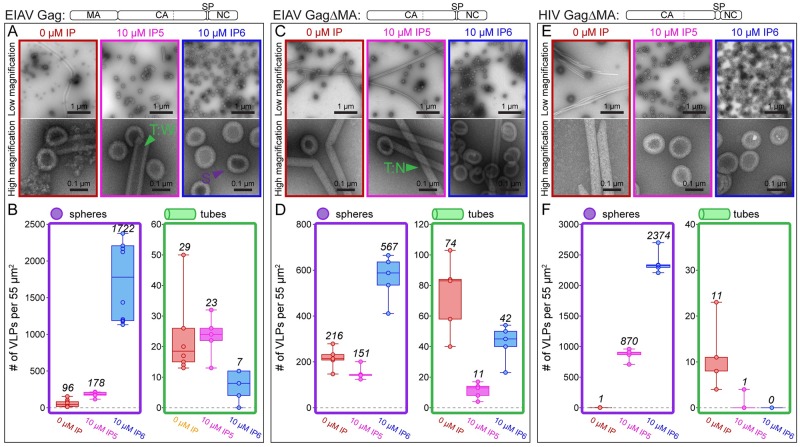
Fig 1. Effect of IP5 and IP6 on in vitro assembly of EIAV Gag, EIAV GagΔMA, and HIV GagΔMA.
(A,C,E) Representative low and high magnification images of respective proteins assembled in the absence (red) or presence of 10 μM IP5 (pink) or 10 μM IP6 (blue) at pH 6. Examples of wide tubes (T:W), narrow tubes (T:N), and spheres (S) are indicated by green and purple triangles. (B,D,F). The number of VLPs (spheres-purple, tubes-green) per 55μm2 for no fewer than five representative images for each condition. Center lines show the medians; box limits indicate the 25th and 75th percentiles as determined by R software; whiskers extend to minimum and maximum values; data points are plotted as circles. Please note the different Y-axis ranges for the bar chart plots in B, D and F. The low magnification images are representative of the distribution of spheres and tubes assembled under different conditions, while the high magnification images were selected to illustrate their morphology. The mean value of counted particles is given in italics in the bar charts.

