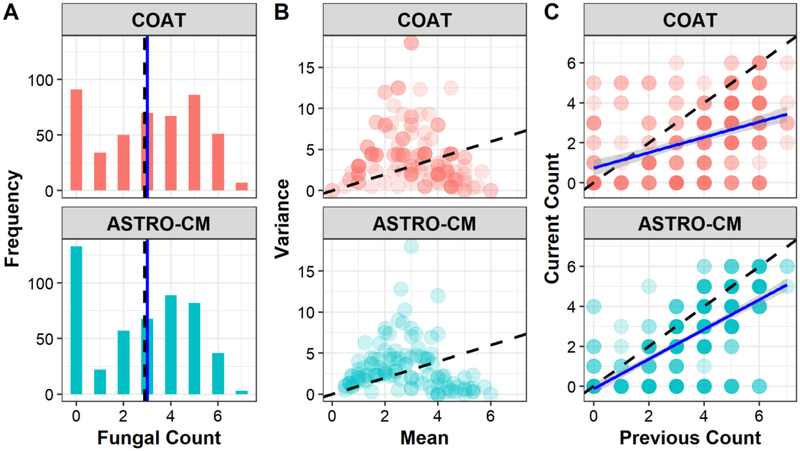
Fig. 4.
Characteristics of log-transformed fungal counts by study. (A) distribution of counts; (B) variance (of individual counts) vs mean (of individual counts); (C) Correlation of counts. Dash black line represents the mean in A and identity line in B & C. Solid blue line is the median in A and is a linear regression line in C whose slope indicates the strength correlation of counts.

