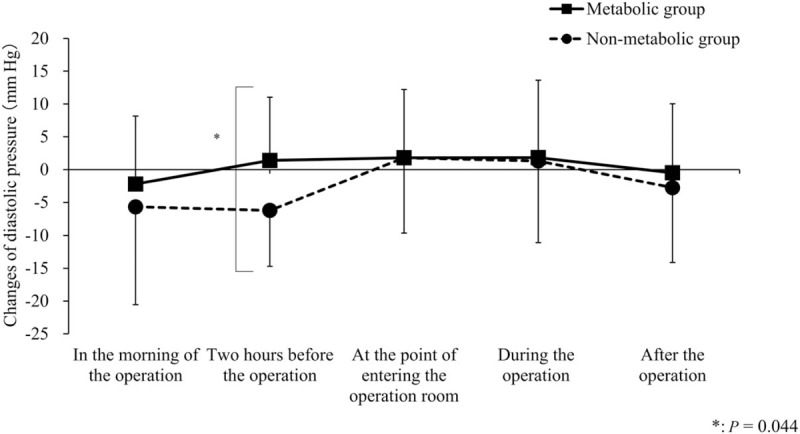
FIGURE 4.

Comparison of changes in the perioperative diastolic pressure of all patients in the metabolic group and the nonmetabolic group. The values showed the changes in systolic pressure of each observation point compared with the values on admission. There was a significant difference in the diastolic pressure 2 hours before the operation between the metabolic group and the nonmetabolic group (P = 0.044). There was no difference between the two groups at the other examination points. Data were presented as mean ± standard deviation.
