
FIGURE 5.
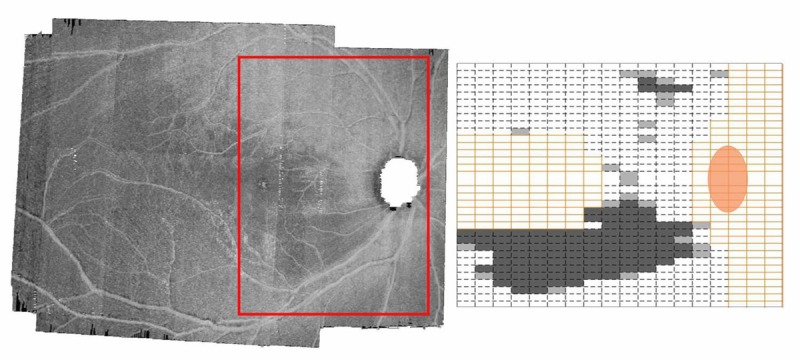
En face image with adjacent probability map for the same participant as in Figs. 3 and 4. The red box in panel A represents the area used for the probability map in panel B. The yellow boxes are excluded from analysis. The light gray boxes represent reflectance below the fifth percentile, and the dark gray boxes are below the first percentile.