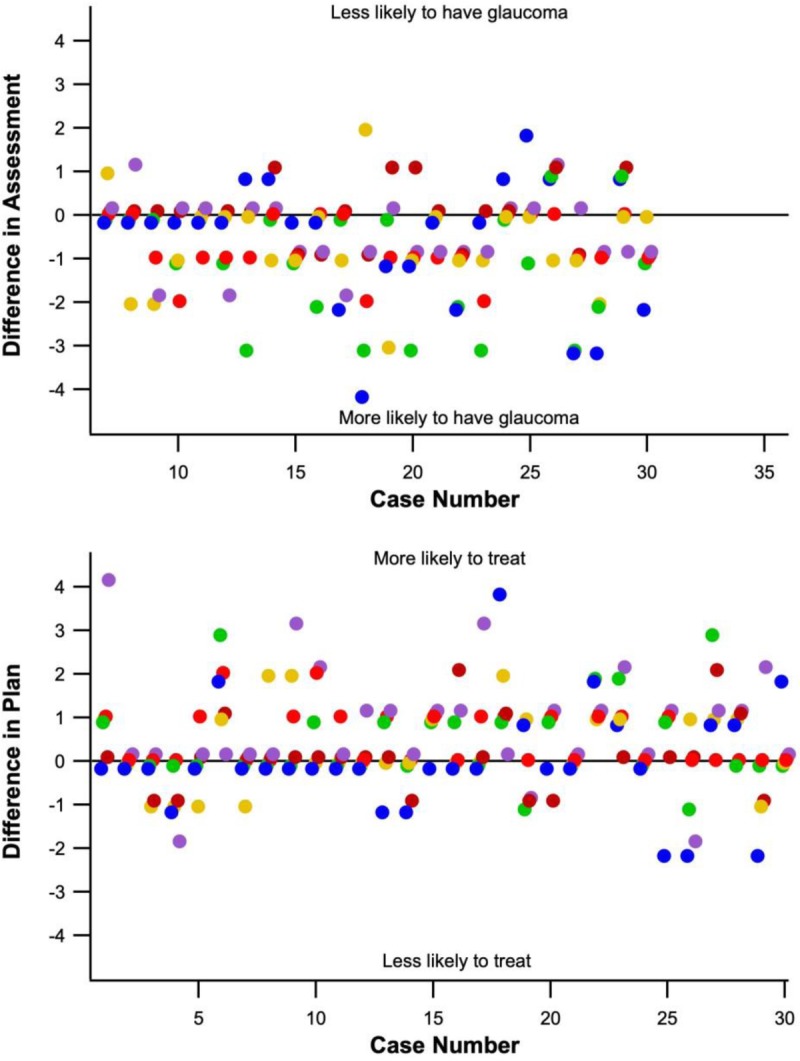
FIGURE 6.

The top panel illustrates changes made to assessments after reviewing the reflectance probability map. Individual masked investigators are represented by separate colors. The top panel shows a tendency to change assessment toward likely to have glaucoma, with 10 changes of three steps or more all toward likely to have glaucoma. The bottom panel illustrates changes made in the plan after observing the reflectance probability map. Note the tendency toward treatment.
