Figure 1.

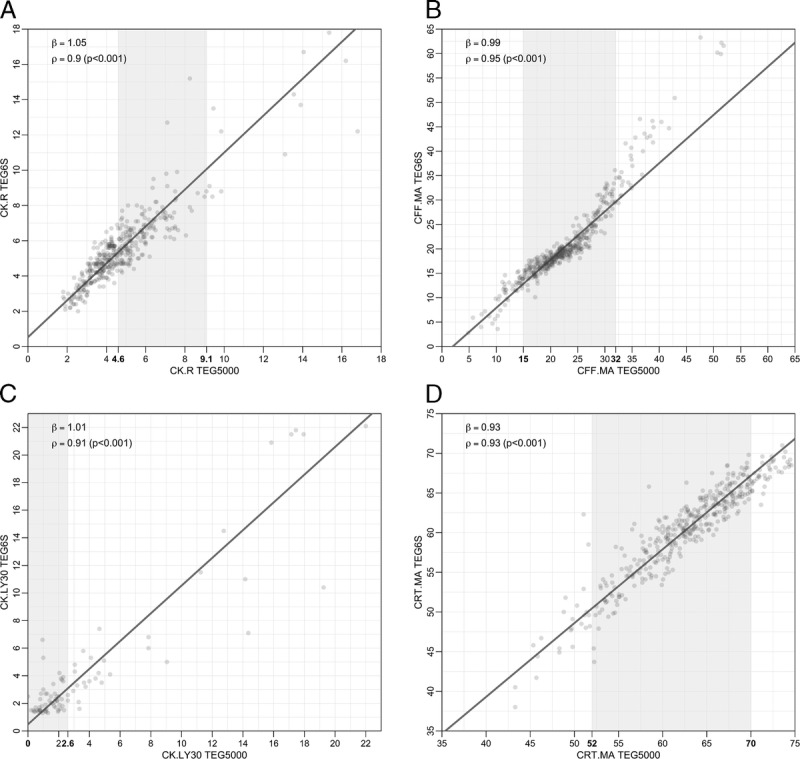
Comparison of TEG 6s vs. TEG 5000 Replicates for CK.R (panel A), CFF.MA (panel B), CK.LY30 (panel C), and CRT.MA (panel D). Axes numbers in bold indicate reference range; the overall range of graph is in line with the AMR.

Comparison of TEG 6s vs. TEG 5000 Replicates for CK.R (panel A), CFF.MA (panel B), CK.LY30 (panel C), and CRT.MA (panel D). Axes numbers in bold indicate reference range; the overall range of graph is in line with the AMR.