Figure 4.
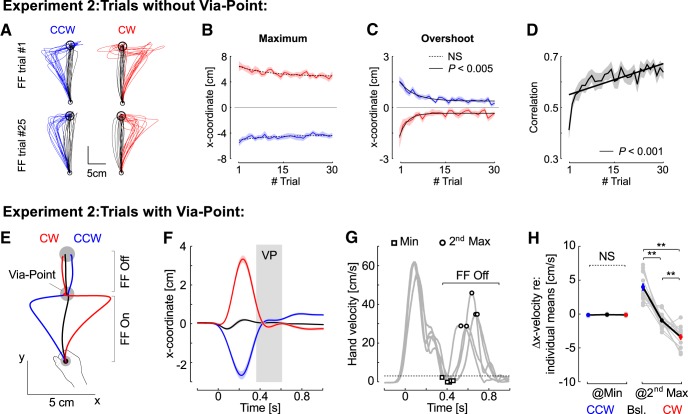
Experiment 2. Behavior. A–C, Illustration of the FF trials and behavior as reported in Figure 1B–D. D, correlations between the commanded force and the measured force across FF trials similar to Figure 2D. E, Average hand traces from experiment 2 for trials with a via-point with the same color code as in experiment 1 (black: null-field, red: CW, blue: CCW). For all trials, the second portion of the reach, from the via-point to the goal, was performed without FF (FF Off). F, Average x-coordinate as a function of time across participants (n = 14). Shaded areas represent 1 SEM across participants. The gray rectangle illustrates the approximate amount of time spent within the via-point. Observe the displacement following the via-point in the opposite direction as the perturbation-related movement. G, Illustration of the trial-by-trial extraction of parameters on five randomly selected trials from one participant. The FF was turned off when the hand speed dropped below 3 cm/s (dashed trace). The parameters extracted were the lateral hand velocity at the moment of the hand speed minimum (squares), and the lateral hand velocity at the moment of the second hand speed maximum (open discs). H, Lateral hand velocity at the moment of hand speed minimum or at the moment of the second hand speed maximum averaged across trials for each participant (gray dots), and averaged across participants (blue, black, and red, mean ± SEM). Individual means across the three trial types were subtracted from the data for illustration purpose. The stars represent significant pair-wise differences at the level p < 0.005 with Bonferroni correction for multiple comparisons. NS, not significant.

