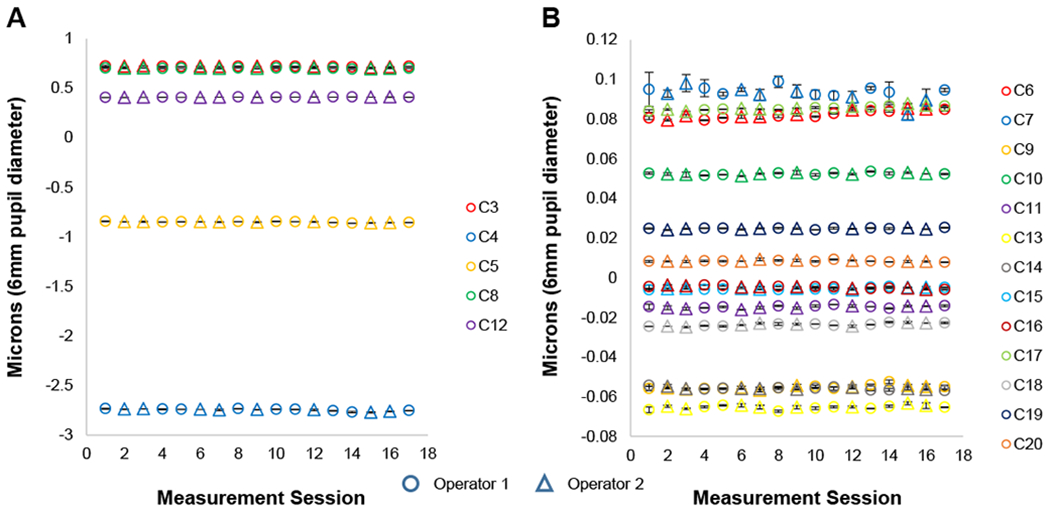
Figure 4.

Zernike aberration coefficients (2nd through 5th radial orders, indicated by C3 through C20) of magnitude (A) greater than 0.1μm and (B) less than 0.1μm for a wavefront-guided lens which remained uncoated and served as a longitudinal control lens over the course of the entire study. Data points are the mean of three repeated measures with replacement and realignment of lenses. Error bars are one standard deviation and indicate short-term within-operator variability. The two operators are indicated by different symbols and indicate longitudinal within-operator variability as well as across-operator variability.
