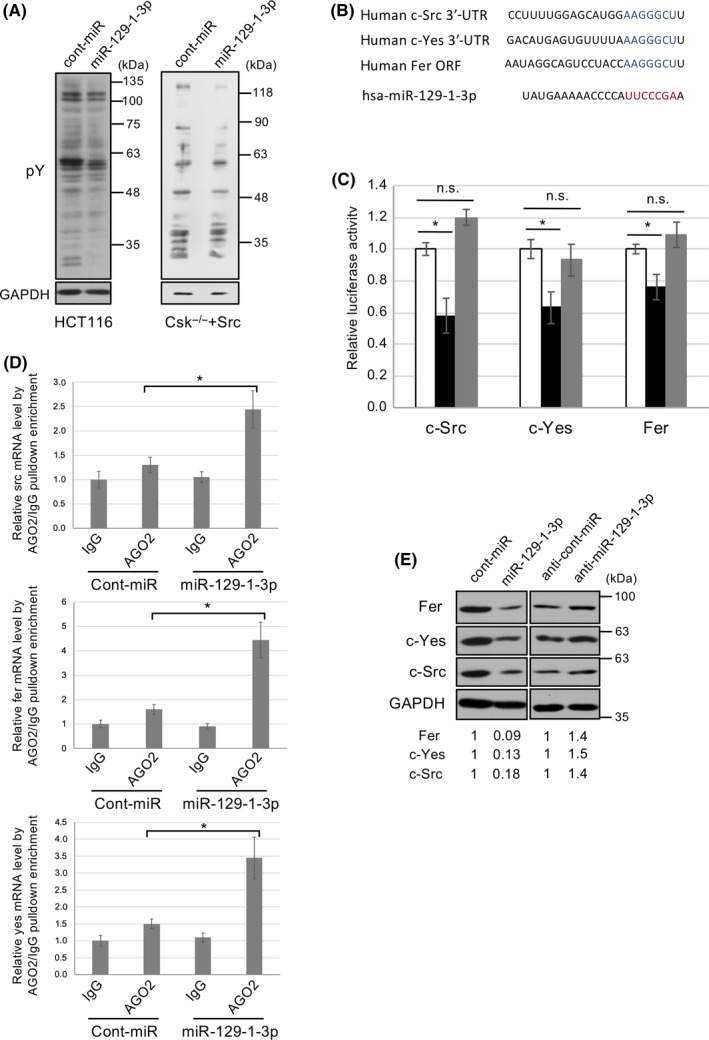
Figure 4.

MicroRNA (miR)‐129‐1‐3p targets c‐Src, c‐Yes, and Fer. A, HCT116 cells or c‐Src‐transformed cells were transfected with control or miR‐129‐1‐3p and subjected to immunoblotting with the indicated Abs. pY, phosphorylated tyrosine residue. B, Alignment of RNA sequences of human miR‐129‐1‐3p and potential miR‐129‐1‐3p binding sequences in the c‐Src and c‐Yes 3′‐UTRs, or Fer ORF. Seed sequences of miR‐129‐1‐3p are shown in red, and binding sequences are shown in blue. C, Luciferase reporter constructs containing WT (white and black) or mutated (mt, gray) c‐Src 3′‐UTRs, c‐Yes 3′‐UTR, or Fer ORF were transfected into HCT116 cells. Cells were treated with control (white) or miR‐129‐1‐3p (black or gray), and relative luciferase activity was determined. Relative Renilla luciferase expression was standardized to a transfection control. D, Ribonucleoprotein immunoprecipitation (RIP) assay of miR‐129‐1‐3p interaction with c‐src, c‐yes, or fer mRNA. Each mRNA coimmunoprecipitated by normal IgG or anti‐AGO2 RIP are shown. E, HCT116 cells were transfected with cont‐miR, miR‐129‐1‐3p, anti‐cont‐miR, or anti‐miR‐129‐1‐3p. Total cell lysates were immunoblotted with the indicated Abs. The relative expression level of each miR‐129‐1‐3p target is shown at the bottom of the panels. Relative values ± SD were obtained from 3 independent assays (C, D). *P < .01 by Student’s t test. n.s., not significant
