
Figure 3.
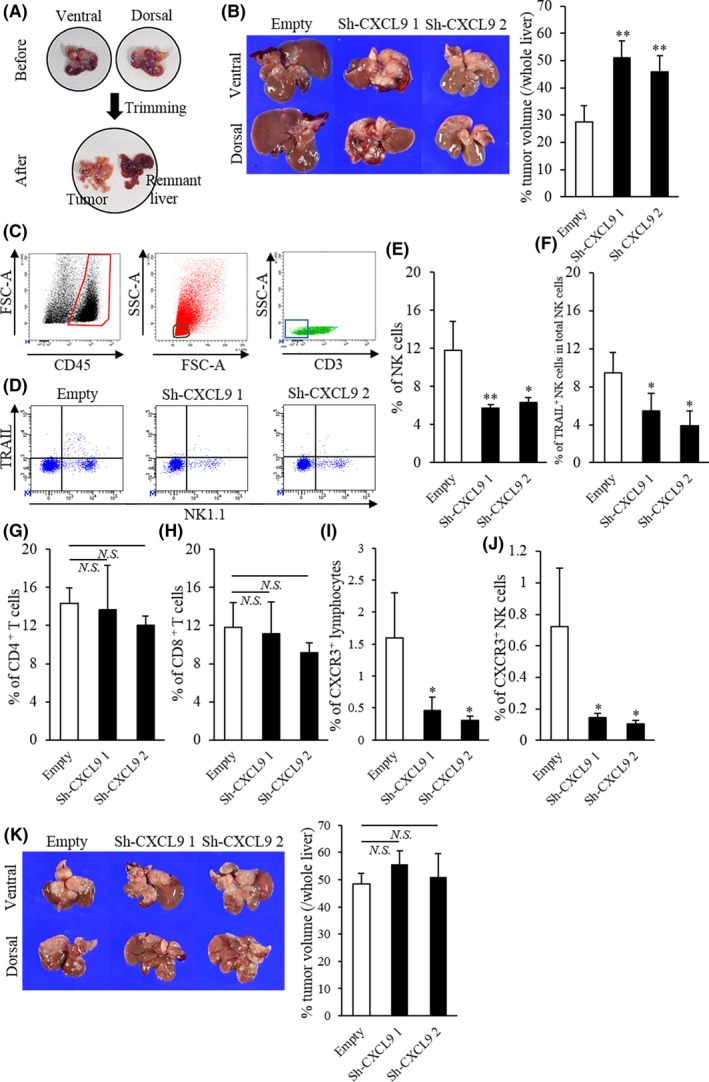
Comparison of liver tumors and tumor‐infiltrating lymphocytes with CXCL9‐sufficient and CXCL9‐deficient cells in mice. A, Tumor‐bearing livers were meticulously dissected to isolate tumors. B, (Left) Representative images of liver tumors, 35 d after 1‐1a cells carrying the empty shRNA, sh‐CXCL9 1 or sh‐CXCL9 2 were inoculated into the spleen; (upper panels) ventral view; (lower panels) dorsal view. (Right) Percentage of tumor/whole liver volumes were significantly higher in CXCL9‐deficient mice compared to CXCL9‐sufficient mice (empty: n = 6; sh‐CXCL9 1: n = 5, sh‐CXCL9 2: n = 6). C, Representative flow cytometry results illustrate gating. (Left) Leukocytes were gated as CD45+ cells (enclosed in red). (Middle) Lymphocytes were identified by low forward scatter (FSC) and low side scatter (SSC) gates (circled in black) and by CD11b expression (data not shown). (Right) The NK and T cell populations were purified from CD3− (boxed in blue) and CD3+ cells, respectively. D, Representative flow cytometry plots show NK1.1 (x‐axis) and TRAIL (y‐axis)‐stained tumor‐infiltrating lymphocytes in tumors from mice with CXCL9‐sufficiency or CXCL9‐deficiencies. E‐J, The percentages of tumor‐infiltrating (E) natural killer (NK) cells, (G) CD4+ T cells, (H) CD8+ T cells, (I) CXCR3+ lymphocytes and (J) CXCR3+ NK cells in total lymphocytes and (F) the percentage of TRAIL+ NK cells in total NK cells are shown for tumors from mice inoculated with 1‐1a cells that carried empty vs sh‐CXCL9 1 or sh‐CXCL9 2 shRNA. (K, Left) Representative images show (top row) ventral and (bottom row) dorsal views of liver tumors at 32 d after cells that carried empty, sh‐CXCL9 1 or sh‐CXCL9 2 shRNA were inoculated into the spleens of NK‐cell‐depleted mice. (Right) Percentages of tumor/whole liver volumes in tumors with CXCL9‐sufficiency or CXCL9‐deficiencies (all groups: n = 4). Isotype controls were used as negative controls to help differentiate non–specific background signal from anti–CD3, NK1.1, TRAIL and CXCR3 Abs. All data are the mean ± SD. *P < 0.05, **P < 0.01, N.S., not significant