
Figure 3.
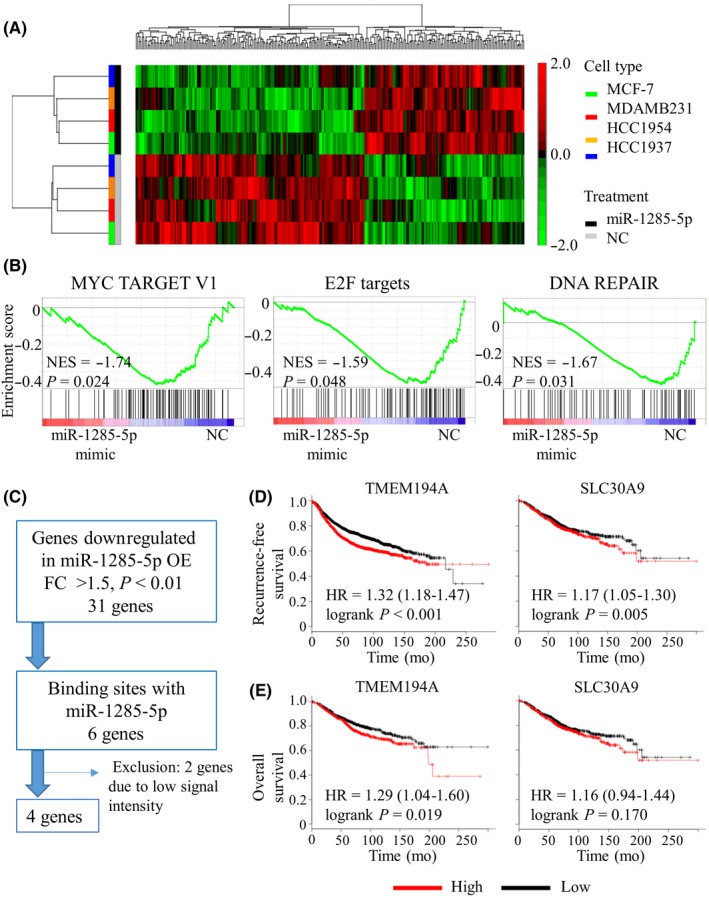
In silico analysis of miR‐1285‐5p targets. A, Heat map diagram with two‐way hierarchical clustering using 260 genes whose expression levels differed by >1.5‐fold (P > 0.05) with overexpression of miR‐1285‐5p vs negative control (NC). Each row represents a gene and each column represents breast cancer cell samples transfected with either miR‐1285‐5p mimic (black) or NC mimic (grey). The cancer cell lines are colored as follows: green for MCF‐7, red for MDA‐MB‐231, orange for HCC1937, and blue for HCC1954. The color scale on the right illustrates the relative expression level of each gene across all samples: red and green are expression levels above and below the mean level, respectively. B, Significantly enriched gene sets using the GSEA of four cancer cell lines transfected with mimic (miR‐1285‐5p/NC). NES, normalized enrichment score. C, Flow diagram showing the selection of target genes of miR‐1285‐5p. D, Kaplan‐Meier plots of recurrence‐free survival according to gene expression level (high/low) that were split by the median value (TMEM194A; P < 0.001 and SLC30A9; P = 0.005). E, Kaplan‐Meier plots of overall survival according to gene expression (high/low) that were split by the median value (TMEM194A; P = 0.019 and SLC30A9; P = 0.170). HR, hazard ratio