Abstract
The tumor suppressor gene p53 encodes a transcriptional activator that has two transactivation domains (TAD) located in its amino terminus. These two TAD can transactivate genes independently, and at least one TAD is required for p53 transactivation function. The 1st TAD (a.a. 1‐40) is essential for the induction of numerous classical p53 target genes, while the second TAD (a.a. 41‐61) suffices for tumor suppression, although its precise molecular function remains unclear. In this study, we comprehensively identified the sites to which p53 lacking the 1st TAD (Δ1stTAD‐p53) binds, as well as its potential target genes. We found that the binding sequences for Δ1stTAD‐p53 are divergent and include not only the canonical p53 consensus binding sequences but also sequences similar to those recognized by a number of other known transcription factors. We identified and analyzed the functions of three Δ1stTAD‐p53 target genes, PTP4A1, PLK2 and RPS27L. All three genes were induced by both full‐length p53 and Δ1stTAD‐p53, and were dependent on the transactivation activity of the 2nd TAD. We also found that two of these, PTP4A1 and PLK2, are endoplasmic reticulum (ER) stress‐inducible genes. We found that upon ER stress, PTP4A1 suppresses apoptosis while PLK2 induces apoptosis. These results reveal a novel Δ1stTAD‐p53 downstream pathway that is dependent on the transcription activation activity of the 2nd TAD.
Keywords: endoplasmic reticulum stress, p53, p53 isoform, Suzuki, transactivation domain, tumor suppressor
The tumor suppressor gene p53 encodes a transcriptional activator that has two transactivation domains (TAD) located in its amino terminus. The 1st TAD (a.a. 1‐40) is essential for the induction of numerous classical p53 target genes, while the second TAD (a.a. 41‐61) suffices for tumor suppression, although its precise molecular function has been unclear. In this study, we comprehensively identified the sites to which p53 lacking the 1st TAD (Δ1stTAD‐p53) binds, as well as its potential target genes. We identified and analyzed the functions of three Δ1stTAD‐p53 target genes, PTP4A1, PLK2 and RPS27L. These results reveal a novel Δ1stTAD‐p53 downstream pathway that is dependent on the transcription activation activity of the 2nd TAD.
1. INTRODUCTION
The tumor suppressor gene p53 is one of the most frequently mutated genes in human cancer and encodes a transcriptional activator that induces a number of genes involved in tumor suppression. It is believed that this transactivation function mediates its tumor suppression function, thereby maintaining the integrity of the cell.1, 2 The p53 protein may be divided into three functional domains: the amino (N)‐terminal domain, the central core DNA‐binding domain and the carboxy‐terminal domain.3, 4 The N‐terminal domain is required for p53 the transcriptional activity and consists of two transactivation domains (TAD) and a proline‐rich domain. These two TAD can transactivate genes independently, and at least one of the two TAD is required for p53 transcriptional activity.5
One of the reported p53 isoforms is p47, which is an N‐terminally deleted isoform whose translation initiates at an internal start codon at amino acids 40 or 44, and, therefore, lacks the 1st TAD.6, 7, 8, 9, 10, 11, 12 This isoform is also referred to as p44, p53/p47, ΔΝp53, Δ40p53 or Δ1stTAD‐p53, the last of which is the designation we use in this manuscript. This isoform was the first identified isoform of p53 and is produced by alternative translation or splicing.7, 8, 9, 10, 11 The existence of an endogenously expressed p53 lacking the 1st TAD raises the possibility that this protein has a specific endogenous role in tumor suppression.
Overexpression of Δ1stTAD‐p53 results in the induction of apoptosis under basal conditions and induces G2 arrest under endoplasmic reticulum (ER) stress conditions, both in a manner dependent on the transcriptional activity of the protein.13, 14 Studies using genetically engineered mice have shown that the activity of the 1st TAD (mapped within a.a. 1‐40) is essential for the induction of numerous classical p53 target genes, cell cycle arrest and apoptosis, while the activity of the second TAD (mapped within a.a. 41‐61) suffices for the induction of senescence and tumor suppression.15, 16 In addition, transgenic mice overexpressing Δ1stTAD show phenotypes of premature aging and growth suppression.17 Furthermore, expression of Δ1stTAD‐p53 is correlated with better survival in sporadic cancer patients, consistent with its ability to induce apoptosis and to transactivate its target genes.18 Previously, we and others have reported that the patterns of p53 target gene induction are different between full‐length p53 (FL‐p53) and Δ1stTAD‐p53.7, 12, 18 In addition, it has been reported that the transactivation functions of FL‐p53 and Δ1stTAD‐p53 differ due to their recruitment of different coactivators: p300 and TAF1.18, 19, 20 These data collectively demonstrate that Δ1stTAD‐p53 exerts its tumor‐suppressive activity through the transcriptional activation of its target genes. However, there has been no comprehensive and/or detailed analysis of Δ1stTAD‐p53 binding sequences or target genes.
In this report, we identified binding sites and genes targeted by Δ1stTAD‐p53 using microarray expression analysis, ChIP‐seq and ChIP‐chip analysis. We next analyzed the functions of three Δ1stTAD‐p53 target genes, PTP4A1, PLK2 and RPS27L. All three genes were induced by both FL‐p53 and Δ1stTAD‐p53, and two of them (PTP4A1 and PLK2) were found to be ER stress‐inducible genes. We also found that following ER stress, PTP4A1 suppresses apoptosis while PLK2 functions in the induction of apoptosis. These results reveal a novel Δ1stTAD‐p53 downstream pathway that is dependent on the transcription activation activity of the 2nd TAD.
2. MATERIALS AND METHODS
For further detailed experimental procedures, please see Appendix S1 Supplemental Materials and Methods.
2.1. Western blotting analysis
Cells were lysed in lysis buffer containing 50 mmol/L Tris‐HCl (pH 8.0), 1% NP40, 250 mmol/L NaCl, 50 mmol/L NaF, 1 mmol/L Na3VO4, 1 mmol/L protease inhibitor (PMSF, aprotinin and leupeptin) and 1 mmol/L DDT. Whole‐cell lysates were subjected to protein quantification and analyzed by western blotting.
2.2. Construction of recombinant adenovirus expressing Δ1stTAD‐p53, PLK2 and PTP4A1
Recombinant adenovirus constructs were made as described previously21, 22 using the Adenovirus Expression Vector Kit (Dual Version) and adenovirus genome DNA‐TPC (TaKaRa) kit.
2.3. Reverse transcription and real‐time PCR
RNA was prepared using an RNeasy Mini Kit (QIAGEN) or total RNA Extraction Kit (RBC Real Genomics). Reverse transcription was carried out as previously described using total RNA (0.5‐1 µg).23, 24 Reverse‐transcribed cDNA were analyzed as previously described.23, 24
3. RESULTS
3.1. Comprehensive analysis of binding sites and genes induced by Δ1stTAD‐p53
As shown in Figure S1, HCT116 p53 −/− cells are derived from HCT116 p53 +/+ cells by replacing the p53 initiation Met located in exon 2 with the initiation Met of the neomycin or hygromycin resistance gene. As a result, expression of FL‐p53 is lost while that of Δ1stTAD‐p53 is retained in these cells.11, 14 It has been reported that the same gene targeting was performed against RKO p53 +/+ cells and RKO p53 −/− cells express Δ1stTAD‐p53 but not FL‐p53.18 As shown in Figure 1A‐C, FL‐p53 expression was mainly detected in HCT116 p53 +/+ cells, while strong expression of Δ1stTAD‐p53 was detected in HCT116 p53 −/− cells. We also found that the size of endogenously expressed Δ1stTAD‐p53 in HCT116 p53 −/− cells completely matched the size of ectopically expressed Δ1stTAD‐p53 (data not shown). Expression of these two variants can be distinguished by the polyclonal anti–p53 antibody FL393, which recognizes various regions of p53, and the monoclonal anti–p53 antibody DO‐1, which recognizes a.a. 20‐25 of p53 (Figure 1A). It has been reported that Δ1stTAD‐p53 expression is upregulated upon cytotoxic stress.11, 14 As shown in Figure 1B,C, nutrient deprivation (FBS or Ser/Gly deprivation) or ER stress (thapsigargin, TG treatment) had little effect on FL‐p53 levels but resulted in elevated Δ1stTAD‐p53 expression levels. We further subjected HCT116 p53 +/+ and −/− cells to serum deprivation for 24 and 48 hours and observed that FL‐p53 levels were slightly decreased while Δ1stTAD‐p53 levels were increased (Figure 1D).
Figure 1.

Comprehensive analysis of Δ1stTAD‐p53 binding sites. A‐D, Western blotting was performed using anti–p53 polyclonal antibody (FL393; A upper panel and B‐D) or monoclonal antibody (DO1; A lower panel). Blots with anti–β‐actin confirmed equal protein loading in each lane. Blue and red arrowheads denote FL‐p53 and Δ1stTAD‐p53, respectively. A, Lysates were from HCT116 p53 +/+ cells treated with fluorouracil (5‐FU) for 16 h or HCT116 p53 −/− cells cultured under basal conditions. B, C, HCT116 p53 +/+ (B) and −/− (C) cells were subjected to serum deprivation (‐FBS, treated with 0.1% FBS, 48 h), Ser and Gly starvation (‐SG, treated for 24 h) or thapsigargin treatment (TG, treated with 500 nmol/L, 18 h). D, The levels of p53 proteins were quantified and are shown as a graph at the bottom. E, FL‐p53 and Δ1stTAD‐p53 binding sites were analyzed by ChIP‐seq analysis, and the results are summarized in a Venn diagram. HCT116 p53 +/+ cells treated with 5‐FU and serum deprived HCT116 p53 −/− cells were used for ChIP‐seq analysis. F‐H, Analysis of FL‐p53 and Δ1stTAD‐p53 binding sequences using HOMER software. Motif analyses were carried out using p53 binding sites selected in E. Binding sites found in both HCT116 p53 +/+ and −/− cells (F), only in HCT116 p53 +/+ cells (G) and sites only found in HCT116 p53 −/− cells (H) were analyzed. Motifs with significant P‐values (<1E‐100) are shown. I, Numbers of potential target genes of Δ1stTAD‐p53. Expression of genes selected in E was analyzed, and genes with significant change in expression levels between the samples (P‐values less than 0.05) were selected. Numbers of selected genes with binding sites common for FL‐p53 and Δ1stTAD‐p53 and genes with specific binding of Δ1stTAD‐p53 are shown
To comprehensively identify Δ1stTAD‐p53 binding sites, we performed ChIP‐seq analysis using the polyclonal anti–p53 antibody FL393 in HCT116 p53 −/− cells. To enhance our detection of Δ1stTAD‐p53 binding sites, we subjected cells to serum deprivation, which upregulates Δ1stTAD‐p53 expression. These results were compared to the previous results obtained by ChIP‐seq analysis using the anti–p53 antibody FL393 in HCT116 p53 +/+ cells treated with fluorouracil (5‐FU). We identified 7349 regions as potential FL‐p53 binding sites (in 5‐FU‐treated HCT116 p53 +/+ cells) and 4737 regions as potential Δ1stTAD‐p53 binding sites (in FBS‐deprived HCT116 p53 −/− cells; Figure 1E). Among these, 1671 regions were common to both FL‐p53 and Δ1stTAD‐p53.
We next analyzed these binding sequences by motif analysis using HOMER software. The p53 binding motif was identified as the most common motif among de novo motifs: it was found in 52.5% of the binding sites common for both FL‐p53 and Δ1stTAD‐p53 (Figure 1F), and in 62.6% of the binding sites for FL‐p53 only (Figure 1G). However, the Δ1stTAD‐p53 binding sequences were more divergent (Figure 1H), with the most common motif among de novo motifs showing similarity to the STAT5 (5.64%), CHR‐like (6.13%) and MTF1‐ like (5.85%) motifs. These results suggest that the binding sites for FL‐p53 are mostly similar to the consensus p53 binding sequences, whereas the binding sites for Δ1stTAD‐p53 may contain not only consensus p53 binding sequences but also sequences recognized by other transcription factors. However, further verification is required to determine if Δ1stTAD‐p53 binds directly to these sequences and transactivates these genes.
3.2. Identification of potential Δ1stTAD‐p53 target genes
We next performed microarray gene expression analysis using HCT116 p53 −/− cells, with or without serum deprivation (three independent datasets for each condition), to identify Δ1stTAD‐p53‐inducible genes. HCT116 p53 +/+ cells without any treatment (three independent datasets) were also included as a sample that is nearly negative for Δ1stTAD‐p53 expression. We then analyzed expression of genes selected in Figure 1E to select potential Δ1stTAD‐p53 target genes using the following three criteria: (i) genes bound by Δ1stTAD‐p53 (selected in Figure 1E); (ii) genes that are transcribed in HCT116 p53 −/− cells (genes with expression values greater than 100 in microarray expression analysis); and (iii) genes that are differentially expressed between HCT116 p53 +/+ and −/− cells or genes that are differentially expressed between FBS‐deprived HCT116 p53 −/− cells and the same cells without the treatment. Three independent analyses were performed for each condition, and genes with a significant change in expression levels between the samples (P‐values less than 0.05) were selected (shown in Table S1). Among genes that were bound by both FL‐p53 and Δ1stTAD‐p53, 62 were significantly increased and 40 were decreased (Figure 1I). In contrast, among the genes that were selectively bound by Δ1stTAD‐p53, 87 were significantly increased and 63 were decreased (Figure 1I). We next analyzed the possible functions of these genes using Ingenuity Pathway Analysis (IPA) software. As shown in Figure S2, the pathways delineated by genes with binding sites common for FL‐p53 and Δ1stTAD‐p53 and pathways delineated by genes that are selectively bound by Δ1stTAD‐p53 are very different. Genes with binding sites common for FL‐p53 and Δ1stTAD‐p53 are involved in pyrimidine deoxyribonucleotides de novo biosynthesis I, VEGF signaling or regulation of cellular mechanics by calpain protease, while genes with binding sites specific for Δ1stTAD‐p53 are involved in cell cycle regulation by BTG family proteins, HIPPO signaling, or spermine biosynthesis. Collectively, these results suggest that Δ1stTAD‐p53 regulates the expression of genes that are not only shared with FL‐p53 but also that are specific for Δ1stTAD‐p53 in HCT116 p53 −/− cells.
3.3. PLK2, PTP4A1 and RPS27L are Δ1stTAD‐inducible genes
Among the potential target genes of Δ1stTAD‐p53, we focused on three genes, PLK2 (Polo‐like kinase‐2), PTP4A1 (protein tyrosine phosphatase 4A) and RPS27L (ribosomal protein S27‐like). PLK2 and PTP4A1 were selected as genes highly expressed in HCT116 p53 −/− cells, and RPS27L was selected as a gene differentially expressed in HCT116 p53 −/− cells with or without serum starvation (Figure S3). p53 binding to these genes was also detected in HCT116 p53 +/+ cells, and, therefore, these genes are also potential target genes of FL‐p53. All these genes have previously been reported as p53 target genes by other groups.25, 26, 27, 28 We previously established p53‐null Saos2 cell lines that stably express a temperature‐sensitive (ts) FL‐p53 or a ts‐Δ1stTAD‐p53 by retrovirus‐mediated gene transfer.12 These ts mutants have the ability to bind to p53 binding sequences and transactivate its target genes under permissive temperature, but lose their abilities under non–permissive temperature. We have shown previously that these cells express comparable levels of ts‐FL‐p53 or ts‐Δ1stTAD‐p53, and ts‐FL‐p53 efficiently induces expression of representative p53 target genes following a temperature shift to the permissive temperature or temperature shift plus γ‐ray irradiation.12 We also established a control cell line transduced with empty retrovirus expressing only the drug resistance gene. We performed microarray expression analysis on RNA prepared from cells treated under each condition. As previously reported, we found that PLK2 is induced in cells that express either FL‐p53 or Δ1stTAD‐p53 (Figure 2A).12 As shown in Figure 2B,C, we found that PTP4A1 and RPS27L were also induced in both cells. Induction of these genes was only seen under permissive temperature, showing that the induction is dependent on the DNA binding ability of Δ1stTAD‐p53. To confirm these results, we ectopically expressed Δ1stTAD‐p53 in p53‐null H1299 cells (Figure 2D). All three genes were efficiently induced by Δ1stTAD‐p53, confirming that these genes are, indeed, Δ1stTAD‐p53‐inducible genes (Figure 2E‐G).
Figure 2.
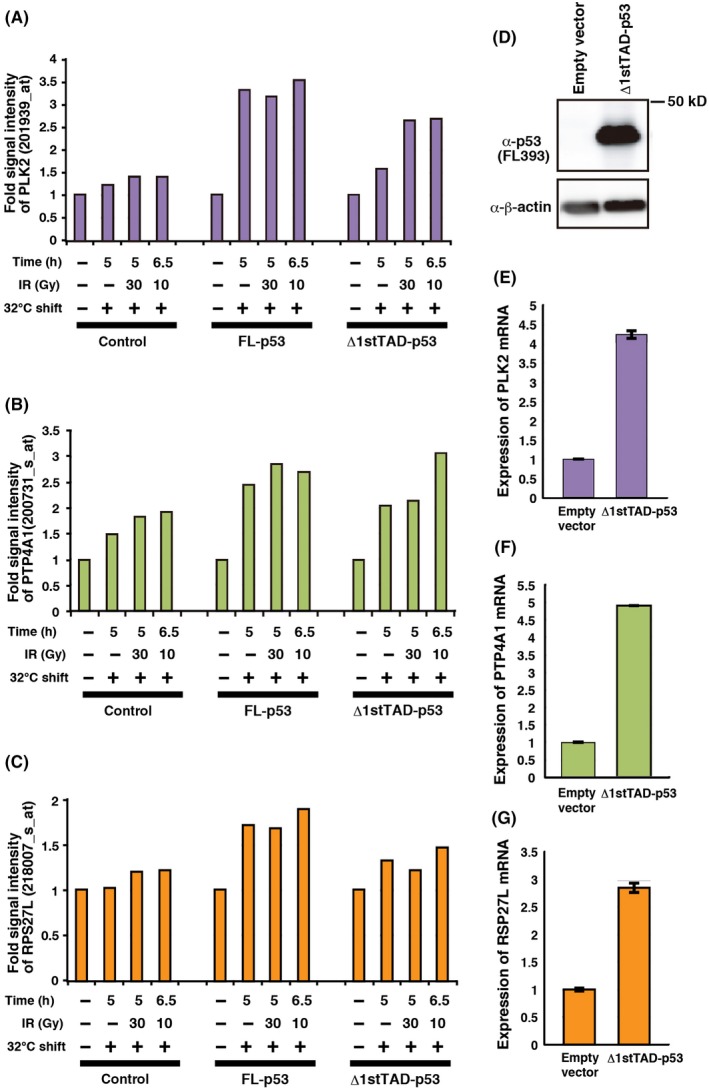
PLK2, PTP4A1 and RPS27L are Δ1stTAD‐p53‐inducible genes. A‐C, Expression of PLK2 (A), PTP4A1 (B) and RPS27L (C) was analyzed by microarray expression analysis. Temperature‐sensitive wild‐type‐expressing, Δ1stTAD‐p53‐expressing or control Saos2 cells were tested for induction of PLK2, PTP4A1 and RPS27L upon temperature shift to the permissive temperature with or without γ‐ray irradiation. Cells were subjected to γ‐ray irradiation (30 or 10 Gy) 2 h after temperature shift to 32°C. Cells were collected 5 or 6.5 h post–temperature shift. Relative induction of the genes in three cell lines upon temperature shift is shown. D‐G, H1299 cells were infected with adenoviruses expressing control Lac Z or Δ1stTAD‐p53 at MOI (multiplicity of infection) 6, and harvested 48 h post–infection. Expression of Δ1stTAD‐p53 was analyzed by western blotting (D). PLK2 (E), PTP4A1 (F) and RPS27L (G) mRNA levels were analyzed by quantitative RT‐PCR.
3.4. Endogenously expressed Δ1stTAD induces PLK2, PTP4A1 and RPS27L
We next analyzed whether endogenously expressed Δ1stTAD‐p53 regulates expression of PLK2, PTP4A1 and/or RPS27L. For this purpose, we compared the expression of PLK2, PTP4A1 and RPS27L mRNA in HCT116 p53 +/+ and −/− cells. As shown in Figure 3A,B and Figure S3A‐C, expression of PLK2 and PTP4A1 was higher in HCT116 p53 −/− cells compared to HCT116 p53 +/+ cells. This result presumably reflects the high expression level of Δ1stTAD‐p53 in HCT116 p53 −/− cells under basal conditions (Figure 1D). In contrast, expression of RPS27L was similar in HCT116 p53 +/+ and −/− cells, despite the fact that FL‐p53 expression level is quite low in HCT116 p53 +/+ cells under basal conditions, suggesting that RPS27L is more strongly induced by FL‐p53 compared to Δ1stTAD‐p53 (Figures 1 and 3BC, Figure S3A,D). Upon serum deprivation, expression of PLK2 and PTP4A1 remained almost unchanged and RPS27L was slightly increased (Figure 3A‐C and Figure S3A‐S3D). These results suggest that although these three genes are Δ1stTAD‐p53‐inducible genes, they are not equally regulated and some factors other than Δ1stTAD‐p53 may affect their expression. We next analyzed whether depletion of Δ1stTAD‐p53 in HCT116 p53 −/− cells affects expression of PLK2, PTP4A1 and/or RPS27L. As shown in Figure 3D‐G, partial knock down of Δ1stTAD‐p53 resulted in decreased expression of PLK2, PTP4A1 and RPS27L. These results demonstrate that endogenously expressed Δ1stTAD‐p53 induces PLK2, PTP4A1 and RPS27L.
Figure 3.
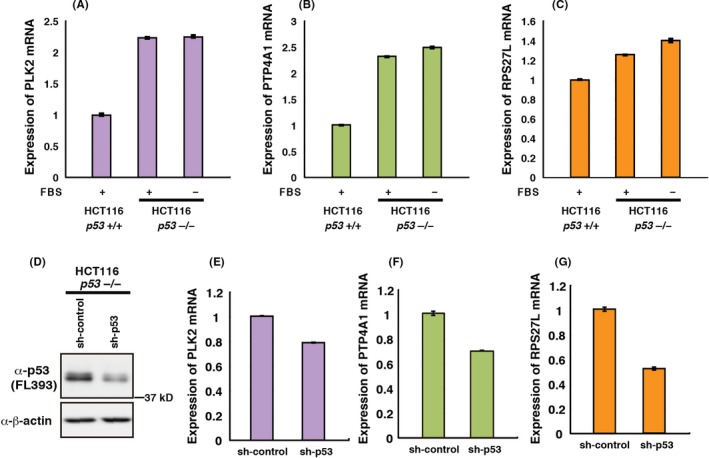
Endogenous Δ1stTAD‐p53 induces PLK2, PTP4A1 and RPS27L. A‐C, Expression of PLK2 (A), PTP4A1 (B) and RPS27L (C) were analyzed by quantitative RT‐PCR in HCT 116 p53 +/+ and −/− cells. HCT116 p53 −/− cells were cultured in normal FBS or subjected to FBS deprivation for 42 h. (D‐G), Control shRNA or shRNA against p53 were stably introduced into HCT116 p53 −/− cells. p53 protein expression levels were analyzed by western blotting (D). PLK2 (E), PTP4A1 (F) and RPS27L (G) mRNA levels were analyzed by quantitative RT‐PCR
3.5. PLK2, PTP4A1 and RPS27L are p53 target genes that require the activity of the 2nd transactivation domain of p53
FL‐p53 contains both the 1st and 2nd TAD of p53, while Δ1stTAD‐p53 contains only the 2nd TAD. Because PLK2, PTP4A1 and RPS27L are induced by either FL‐p53 or Δ1stTAD‐p53, we further examined the requirements for the 1st and the 2nd TAD of p53. For this purpose, we generated two additional mutant p53s: W53Q/F54S, which retains activity of the 1st TAD while the 2nd TAD is inactive; and Δ1stTAD‐p53 W53Q/F54S, in which both TAD are inactive (Figure 4A‐K). Expression of each p53 was confirmed by western blotting (Figure 4B,G). We observed that the 2nd TAD is required for full expression of previously reported p53 target gene PHLDA3, as have previously reported (Figure 4F,K).15, 22 In addition, expression of PLK2, PTP4A1 and RPS27L require the activity of the 2nd TAD of both FL‐p53 and Δ1stTAD‐p53 (Figure 4C‐E,H‐J). These results show that PLK2, PTP4A1 and RPS27L are inducible by either FL‐p53 or Δ1stTAD‐p53, and this induction requires the activity of the 2nd TAD of p53.
Figure 4.
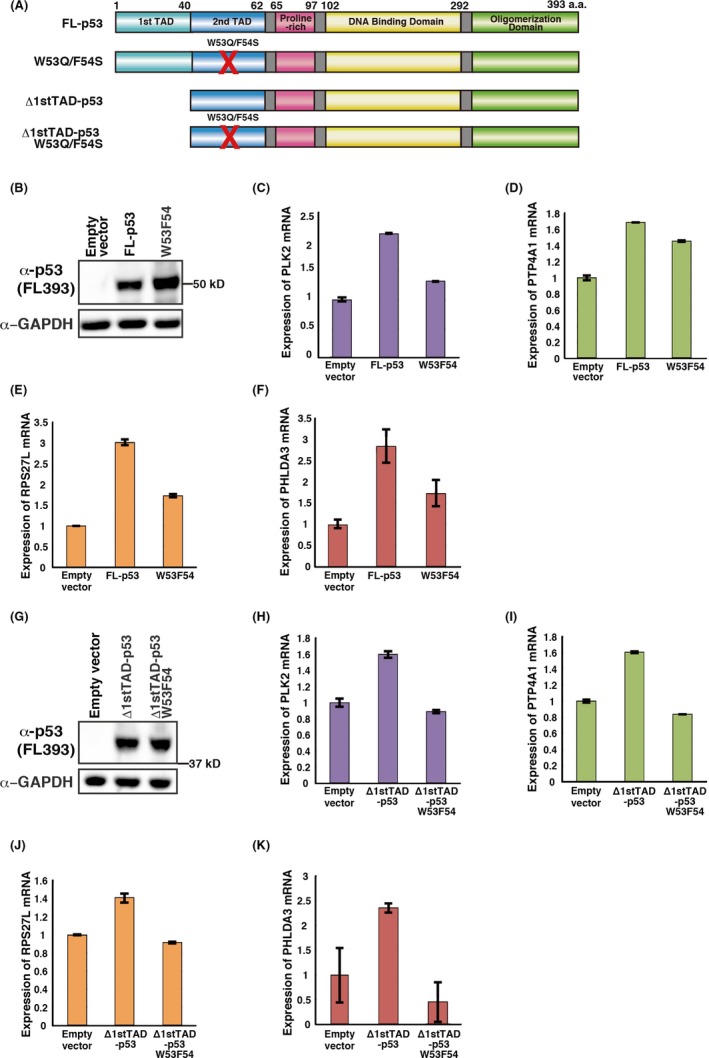
Transcription of PLK2, PTP4A1 and RPS27L are induced in a manner dependent on the activity of the 2nd transactivation domain of p53. A, Schema of p53 constructs used in this study. B, G, Expression of p53 constructs was analyzed by western blotting. (C‐F, H‐K), H1299 cells were transfected with the indicated p53 constructs and harvested 24 h post–transfection. PLK2 (C, H), PTP4A1 (D, I), RPS27L (E, J) and PHLDA3 (F, K) mRNA levels were analyzed by quantitative RT‐PCR
3.6. PLK2, PTP4A1 and RPS27L are direct target genes of Δ1stTAD‐p53
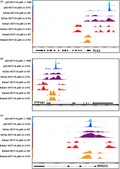
We next used ChIP‐seq and ChIP‐chip analysis to examine whether PLK2, PTP4A1 and RPS27L are direct target genes of FL‐p53 and/or Δ1stTAD‐p53. We analyzed HCT116 p53 −/− cells subjected to FBS deprivation and HCT116 p53 +/+ cells either treated or not treated with 5‐FU. As shown in Figure 5A‐C, Figure S4 and Table S2, we observed binding of both FL‐p53 and Δ1stTAD‐p53 to the PLK2, PTP4A1 and RPS27L genomic regions in HCT116 p53 +/+ or p53 −/− cells. To further confirm the results, a ChIP assay was performed using p53‐null Saos2 cells expressing temperature‐sensitive FL‐p53 or Δ1stTAD‐p53 (Figure 6A). Using these cells, binding of both FL‐p53 and Δ1stTAD‐p53 to the PLK2, PTP4A1 and RPS27L genomic regions was confirmed. p53 binding to the PLK2 genomic region was observed at approximately 2 kb upstream of the transcription initiation site. We observed H3K27 acetylation within this region in 5‐FU‐treated HCT116 p53 +/+ cells, indicating transcriptional activity induced by 5‐FU. We also detected H3K4 tri‐methylation surrounded by H3K4 mono‐methylation at the PLK2 gene promoter region, indicating that PLK2 is actively transcribed in both unstressed and stressed conditions. In contrast, p53 binding was observed within intron 1 of both the PTP4A1 and RPS27L genomic regions, and these regions were positive for H3K27 acetylation in HCT116 p53 +/+ cells regardless of 5‐FU treatment, although acetylation increased upon 5‐FU treatment. This indicates that these regions are transcriptionally active even in the basal condition, and further induced upon 5‐FU treatment. We also detected H3K4 tri‐methylation surrounded by H3K4 mono‐methylation at the PTP4A1 and RPS27L gene promoter regions, indicating that they are actively transcribed in both unstressed and stressed conditions. We also found sequences highly similar to the p53 consensus binding sequences within the p53 binding regions of each gene (Figure 6B). These three genes have previously been identified as p53 target genes,25, 26, 27, 28 and the p53 binding sequences we identified were the same as previously described for PLK2 and PTP4A1, but different for RPS27L. The p53 binding sequence in RPS27L was previously reported to be 5'‐GGGCATGTagtGACTTGCCC‐3' (chr15: 61236487‐61236506, NCBI36/hg18; sequences shown in upper case match the consensus p53 binding sequence).27, 28 This sequence overlapped the p53 binding sequence that we identified (chr15: 61236477‐61236496). The calculated TRANSFAC match score for the sequence we identified is 0.704, while the score for the previously reported sequence is 0.621.
Figure 5.
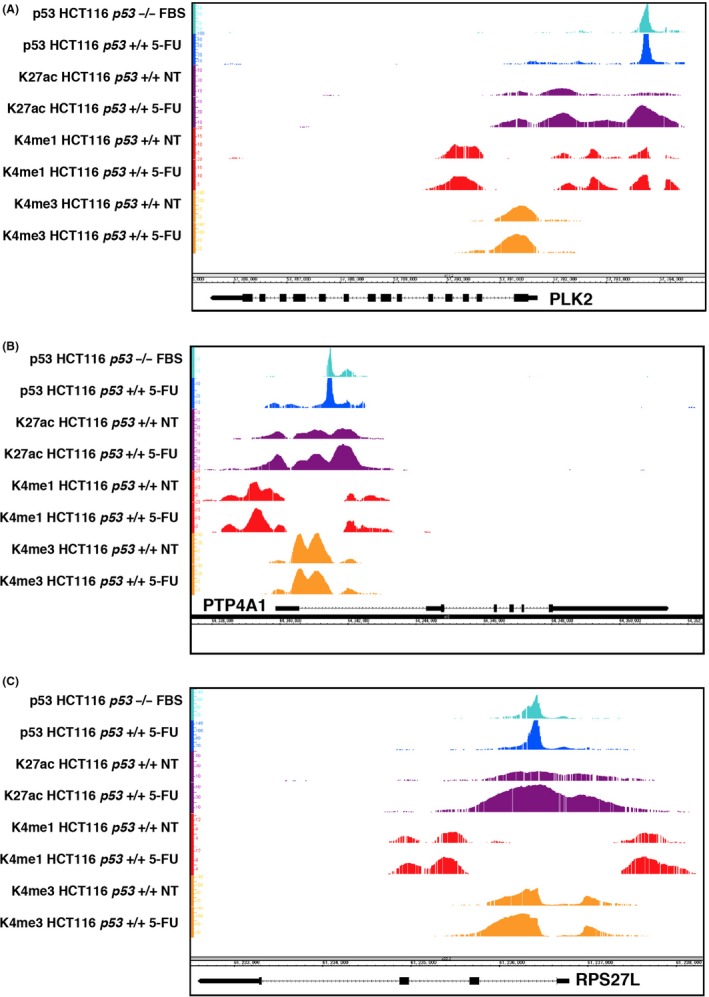
PLK2, PTP4A1 and RPS27L are direct target genes of both FL‐p53 and Δ1stTAD‐p53. A‐C, Genomic loci of PLK2 (chr5:57,783,671‐57,798,263) (A), PTP4A1 (chr6:64,332,522‐64,369,290) (B) and RPS27L (chr15:61,232,500‐61,238,300) (C) are shown together with the ChIP‐seq results. HCT116 p53 +/+ cells treated with or without fluorouracil (5‐FU) and serum‐deprived HCT116 p53 −/− cells were used for ChIP‐seq analysis. ChIP‐seq analyses were performed using antibodies against p53, H3K27ac, H3K4me1 and H3K4me3. The resulting sequences were mapped to the build #36 reference human genome (hg18)
Figure 6.
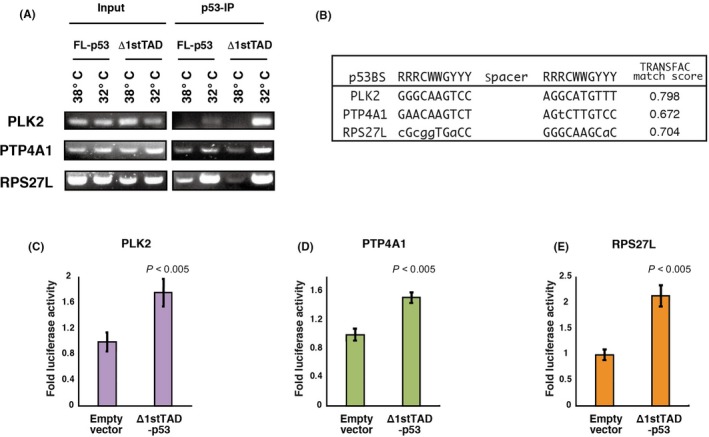
The p53 responsive elements of PLK2, PTP4A1 and RPS27L are bound and activated by Δ1stTAD‐p53. A, ChIP assay was performed for the PLK2, PTP4A1 and RPS27L promoters. Saos2 cell lines expressing ts‐FL‐p53 or ts‐Δ1stTAD‐p53 were used to analyze p53 binding to the promoters upon temperature shift to the permissive temperature. B, Nucleotide sequences of p53 binding sites together with the consensus p53 binding sequences are shown. Sequences that match the consensus sequences are shown in upper case. TRANSFAC match scores are also calculated. C‐E, The p53 binding sequences of PLK2 (C), PTP4A1 (D) and RPS27L (E) were cloned upstream of firefly luciferase reporter gene with a minimal promoter, and a luciferase reporter assay was performed. The experiment was run in triplicate, and data are represented as the mean fold activation ± SD
To further analyze whether the p53 binding sequences are bound and activated by p53, the genomic region containing the sequences were cloned and assayed for Δ1stTAD‐p53 responsiveness by luciferase reporter assay. As shown in Figure 6C‐E, Δ1stTAD‐p53 responsiveness was detected for all three reporter genes. These data collectively show that PLK2, PTP4A1 and RPS27L are direct target genes of both FL‐p53 and Δ1stTAD‐p53.
3.7. PLK2 and PTP4A1 are induced upon endoplasmic reticulum stress
As shown in Figure 1C, Δ1stTAD‐p53 expression was elevated upon ER stress induced by TG treatment. We therefore analyzed whether PLK2, PTP4A1 and RPS27L are induced upon ER stress (Figure 7A‐I). We first analyzed the time course of Δ1stTAD‐p53 upregulation upon TG treatment. As shown in Figure 7A,B, expression of FL‐p53 decreased upon TG treatment, while that of Δ1stTAD‐p53 increased. Interestingly, upon TG treatment, Δ1stTAD‐p53 was phosphorylated at Ser46, a residue reported to be involved in the enhancement of the apoptosis‐inducing ability of p53.29, 30 This suggests the possibility that TG treatment leads to Ser46‐induced activation of Δ1stTAD‐p53 (Figure 7C). We next analyzed the mRNA expression levels of PLK2, PTP4A1 and RPS27L. As shown in Figure 7D,E, PLK2 and PTP4A1 expression were increased upon TG treatment in both HCT116 p53 +/+ and −/− cells but were increased higher in HCT116 p53 −/− cells. In contrast, expression of RPS27L was not changed significantly upon TG treatment in either HCT116 p53 +/+ or −/− cells (Figure S5). We therefore focused on PLK2 and PTP4A1, and further analyzed whether expression of these genes in HCT116 p53 −/− cells is dependent on Δ1stTAD‐p53. We knocked down Δ1stTAD‐p53, and as shown in Figure 7F,I, Δ1stTAD‐p53 expression was effectively knocked down by siRNA against p53. Both basal and TG‐induced PTP4A1 expression were decreased by Δ1stTAD‐p53 knock down (Figure 7G). Basal PLK2 expression was also decreased by Δ1stTAD‐p53 knock down, but TG‐induced PLK2 expression was not significantly affected (Figure 7H). Thus, while TG‐induced PTP4A1 expression in HCT116 p53 −/− cells is dependent on Δ1stTAD‐p53, TG‐induced PLK2 expression is not dependent on Δ1stTAD‐p53.
Figure 7.
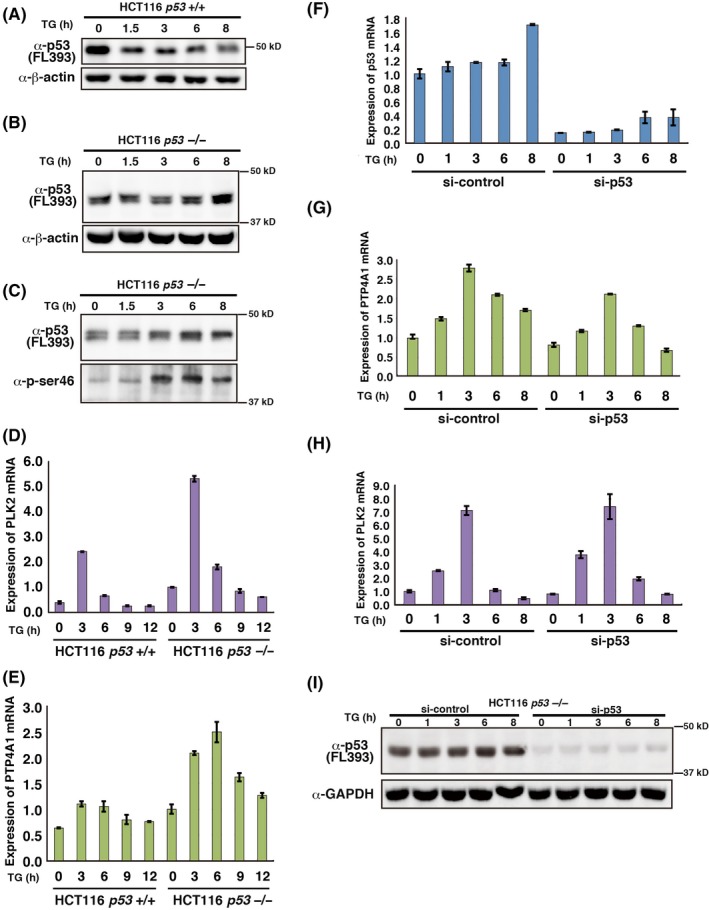
PLK2 and PTP4A1 are induced upon ER stress. A‐E, HCT 116 p53 +/+ and −/− cells were treated with 500 nmol/L thapsigargin (TG). Cells were harvested at the indicated times post–treatment. p53 and β‐actin protein expression levels were analyzed by western blotting (A, B). p53 phospho‐Ser 46 protein levels were analyzed from immunoprecipitated p53 (C). Immunoprecipitation of p53 was performed using anti–p53 antibodies (Pab421 and Pab1801). PLK2 (D) and PTP4A1 (E) mRNA levels were analyzed by quantitative RT‐PCR. F‐I, HCT 116 p53−/− cells were transfected with control siRNA or siRNA against p53. Cells were treated with 500 nmol/L TG 40 h post–siRNA transfection and were harvested at the indicated times post–TG treatment. Expression of p53 (F), PTP4A1 (G) and PLK2 (H) mRNA levels was analyzed by quantitative RT‐PCR. Expression of p53 and GAPDH protein levels were analyzed by western blotting (I)
3.8. PTP4A1 suppresses endoplasmic reticulum stress‐dependent apoptosis
Because we found that PTP4A1 is induced by TG treatment, we next analyzed the function of PTP4A1 upon ER stress. We knocked down PTP4A1 by siRNA and analyzed the DNA content of the cells by FACS (Figure 8A,B). We found that compared to control siRNA‐treated cells, PTP4A1 siRNA‐treated cells had higher sub–G1 DNA content upon TG treatment (Figure 8B). In addition, as shown in Figure 8A,C, these cells also had higher levels of cleaved PARP and cleaved caspase 3, and contained a higher number of TUNEL‐positive cells compared to control cells. Next, we ectopically expressed PTP4A1 by adenovirus‐mediated gene transfer. As shown in Figure 8D,E, overexpression of PTP4A1 resulted in a decrease in the fraction of cells exhibiting sub–G1 DNA content induced by TG treatment. Finally, we analyzed the subcellular localization of PTP4A1 following TG treatment. As shown in Figure 8F, under basal conditions PTP4A1 was localized to the cytoplasmic region, except for the ER, and accumulated in the ER region following TG treatment. These results collectively indicate that PTP4A1 suppresses TG‐induced apoptosis by upregulating the unfolded protein response and relocalizes to the ER in response to ER stress, where it potentially exerts some specific function.
Figure 8.
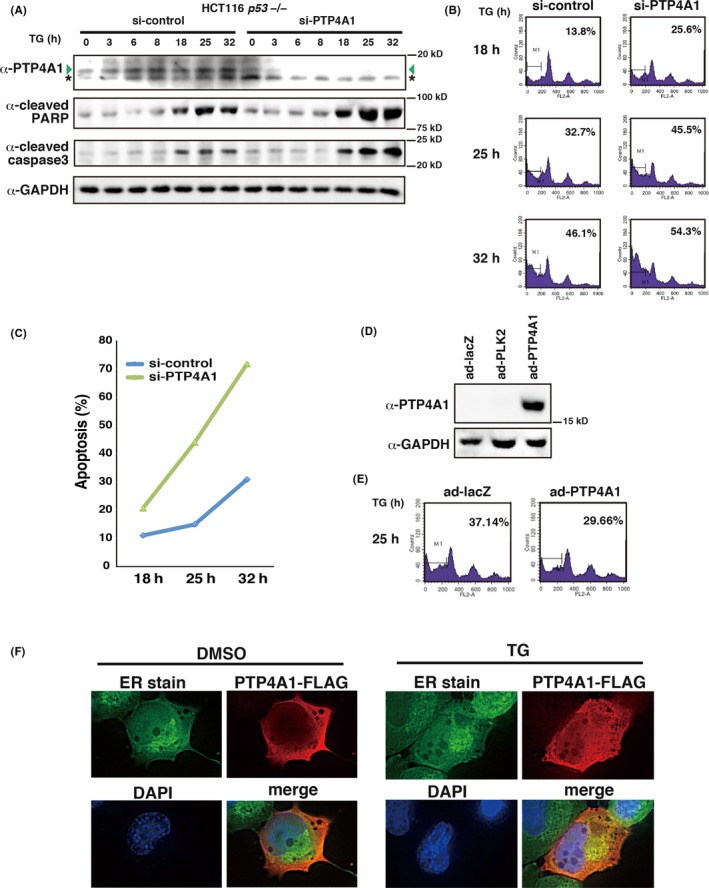
PTP4A1 suppresses endoplasmic reticulum (ER) stress‐dependent cell death. A‐C, HCT 116 p53 −/− cells were transfected with control siRNA or siRNA against PTP4A1. Cells were treated with 500 nmol/L TG 40 h post–siRNA transfection and were harvested at the indicated times post–TG treatment. A, Expression levels of PTP4A1, PARP, cleaved caspase 3 and GAPDH proteins were analyzed by western blotting. Green arrowhead and asterisk denote PTP4A1 and non–specific bands, respectively. B, C, Cells with sub–G1 DNA content (B) and TUNEL‐positive cells (C) were analyzed by FACS at the indicated times. The experiment was repeated three times and the representative data are shown (C). D, E, PTP4A1 overexpression leads to suppression of ER stress‐dependent cell death. HCT116 p53 −/− cells were infected with adenoviruses expressing control Lac Z (ad‐lacZ) or PTP4A1 (ad‐PTP4A1) at 5 moi, treated with 500 nmol/L TG 24 h post–infection, and harvested 25 h post–TG treatment. Expression levels of PTP4A1 protein were analyzed by western blotting (D). Cells with sub–G1 DNA content were analyzed by FACS (E). F, PTP4A1 translocates to the ER under ER‐stressed condition. H1299 cells were transfected with control or PTP4A1‐FLAG expression vectors, and cells were treated with control DMSO or 500 nmol/L thapsigargin for 6 h. Localization of PTP4A1‐FLAG was visualized by anti–FLAG antibody. ER was detected by ER stain
3.9. PLK2 induces endoplasmic reticulum stress‐dependent apoptosis
Although upregulation of PLK2 upon ER stress is not Δ1stTAD‐p53‐dependent, the function of PLK2 in ER stress has not been clarified. Because we found that PLK2 is also induced by TG treatment, we next analyzed its function in ER stress (Figure 9A‐G). We knocked down PLK2 by siRNA and analyzed the DNA content of the cells by FACS (Figure 9A,C). Compared to control siRNA‐treated cells, PLK2 siRNA‐treated cells had lower sub–G1 DNA content (Figure 9C). Furthermore, we observed fewer TUNEL‐positive cells in the PLK2 knocked down cells compared to control cells, as well as less cleaved PARP and cleaved caspase 3 expression (Figure 9B,D). We next ectopically expressed PLK2 by adenovirus‐mediated gene transfer. As shown in Figure 9E,F, expression of PLK2 had no effect on TG‐induced apoptosis, suggesting the possibility that endogenously expressed PLK2 is sufficient to induce apoptosis upon TG treatment. Finally, we analyzed the subcellular localization of PLK2 with or without TG treatment. As shown in Figure 9G, PLK2 localized to the cytoplasmic region overlapping the ER region under basal conditions but translocated to the plasma membrane upon TG treatment. These results collectively indicate that PLK2 enhances TG‐induced apoptosis and may have a function at the plasma membrane in response to ER stress.
Figure 9.
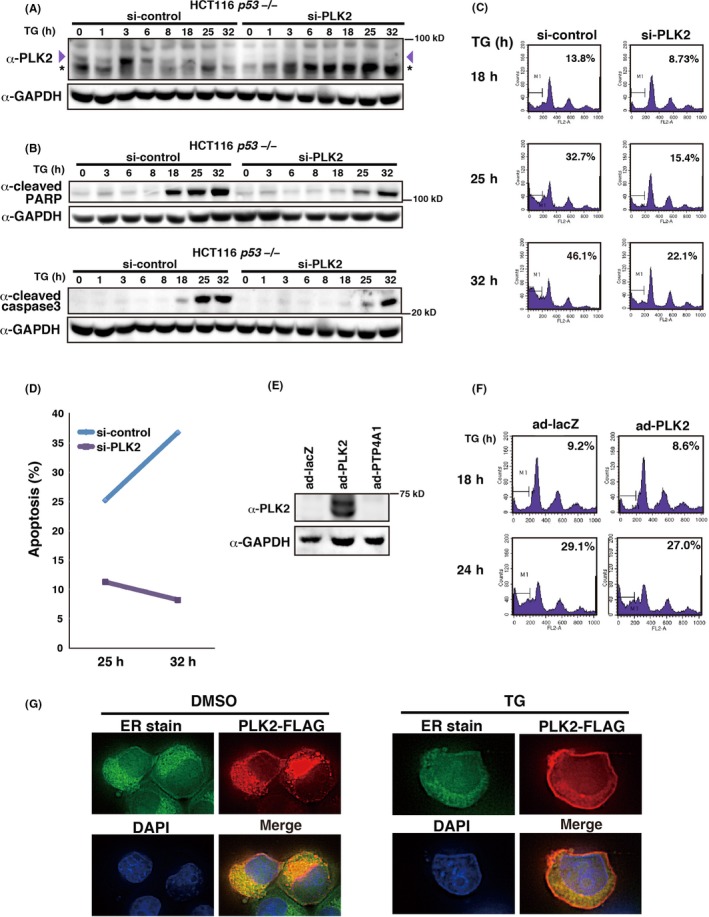
Knockdown of PLK2 suppresses endoplasmic reticulum (ER) stress‐dependent cell death. A‐D, HCT 116 p53 −/− cells were transfected with control siRNA or siRNA against PLK2, and were analyzed as in Figure 8A‐C. A, B, Expression of PLK2, PARP, cleaved caspase 3 and GAPDH protein levels were analyzed by western blotting. Purple arrowhead and asterisk denote PLK2 and non–specific bands, respectively. C, D, Cells with sub–G1 DNA content (C) and TUNEL‐positive cells (D) were analyzed by FACS. E, F, PLK2 overexpression does not enhance ER stress‐dependent cell death. Adenoviruses expressing PLK2 (ad‐PLK2) were used and analyzed as in Figure 8D,E. Expression of PLK2 protein levels was analyzed by western blotting (E). Cells with sub–G1 DNA content were analyzed by FACS (F). G, PLK2 translocates to the plasma membrane under ER‐stressed conditions. H1299 cells were transfected with control or PLK2‐FLAG expression vectors and were analyzed as in Figure 8F
4. DISCUSSION
Recently, several reports have confirmed the relevance of the 2nd TAD within p53 in the induction of tumor suppression, apoptosis and senescence.7, 12, 13, 14, 15, 16, 17, 18, 31 Therefore, understanding how p53 modulates these biological functions requires a better characterization of the function of the 2nd TAD. The Δ1stTAD‐p53 construct, which retains only the 2nd TAD, is an ideal p53 variant for studying the function of the 2nd TAD of p53. In this study, we identified a number of Δ1stTAD‐p53‐inducible genes by microarray expression and ChIP‐seq analysis, and comprehensively analyzed the sequences of their Δ1stTAD‐p53 binding sites. We found that while some of the Δ1stTAD‐p53 binding regions are shared with FL‐p53, some of them are specific for Δ1stTAD‐p53. The binding sites shared with FL‐p53 showed a high similarity to the p53 consensus binding sequences, whereas the sites specific for Δ1stTAD‐p53 were highly divergent and included sites with similarity to the binding sites for several other transcription factors. Δ1stTAD‐p53 may bind to these divergent sequences directly or indirectly, because p53 can localize to promoter regions through binding to other transcriptional factors (eg, GATA‐1 or STAT‐1).32, 33
Furthermore, by combining the ChIP‐seq data and microarray expression analysis data, we identified potential Δ1stTAD‐p53 target genes, among which there were three novel Δ1stTAD‐p53‐induced target genes: PLK2, PTP4A1 and RPS27L. Interestingly, two of these genes, PLK2 and PTP4A1, are strongly induced upon ER stress and function to enhance and repress ER stress‐induced apoptosis, respectively. Because ablation of PTP4A1 results in enhancement of apoptosis upon ER stress, PTP4A1 may protect cells from stresses. PTP4A1 is a protein tyrosine phosphatase that promotes the growth and migration of tumor cells through unknown mechanisms.34, 35 PTP4A1 has very low activity in vitro and robust substrates have not been reported and some of the functions of PTP4A1 are probably exerted through protein‐protein interaction that does not require the phosphatase activity.36, 37 Because PTP4A1 localizes to ER upon ER stress, PTP4A1 may act on some protein localized to ER. The precise molecular function of PTP4A1 in ER stress warrants further investigation. In contrast, PLK2 may function to induce apoptosis when cells are severely damaged by various types of stress. Previously, PLK2 has been reported to be a p53 target gene that confers resistance to antimicrotubule agents.25 However, we have shown that upon ER stress, PLK2 is a pro–apoptotic gene. We also showed that under basal conditions, PLK2 localizes to the ER. PLK2 has been reported to phosphorylate proteins localized on the ER (Grp94 and calumenin38) and may regulate their functions. Interestingly, the subcellular localization of both PTP4A1 and PLK2 are altered upon ER stress, possibly because these proteins have a specific function at these sites in response to ER stress.
We confirmed previous reports that expression of Δ1stTAD‐p53 is induced following cytotoxic stresses such as nutrient deprivation and ER stress.11, 14 The fact that Δ1stTAD‐p53 as well as its target genes are both regulated by ER stress suggests that the Δ1stTAD‐p53 downstream pathway and the ER stress pathway functionally overlap. We found that Δ1stTAD‐p53 induces genes that enhance (PLK2) and repress (PTP4A1) ER stress‐induced apoptosis. It has been reported that p53 induces both pro–apoptotic genes such as Noxa or Puma and anti–apoptotic genes such as p21 depending on the stress levels the cells have suffered. Δ1stTAD‐p53 may also induce different sets of genes to enhance or repress apoptosis according to the stress levels.
Finally, RPS27L was previously shown to function in ribosomal stress.39 Disruption of the endogenous RPS27L results in activation of p53 through an increase in the binding of Mdm2 to ribosomal proteins and a consequent decrease in p53 degradation.39 Because Δ1stTAD‐p53 lacks the N‐terminal Mdm2 binding domain, it is expected that RPS27L should effect only FL‐p53 and not Δ1stTAD‐p53. RPS27L is itself induced by either FL‐p53 or Δ1stTAD‐p53, so we might expect that this induction leads to an alteration in the relative abundance of endogenous FL‐p53 and Δ1stTAD‐p53.
In this paper, we have analyzed three novel Δ1stTAD‐p53 target genes. These genes are also targets of FL‐p53, and their transcription depends on the 2nd TAD of p53. We also identified several other potential Δ1stTAD‐p53‐specific target genes involved in cell cycle regulation by the BTG of family proteins and HIPPO signaling. These and other Δ1stTAD‐p53‐specific target genes should be analyzed next to further elucidate 2nd TAD‐specific functions.
DISCLOSURE
The authors have no financial relationships to disclose.
Supporting information
ACKNOWLEDGMENTS
We thank Dr Hitoshi Kurumizaka for mentoring S. Suzuki at Waseda University. We thank Dr Marc Lamphier for critical reading of the manuscript. This study was partly supported by a Grant‐in‐Aid for Scientific Research (B) (#17H03587) (RO), a Grant‐in‐Aid for Young Scientists (B) (#19K16732) (YC) from the Ministry of Education, Culture, Sports, Science and Technology of Japan, research grants from the Applied Research for Innovative Treatment of Cancer from the Ministry of Health, Labour and Welfare (RO), P‐Direct and P‐Create from the Japan Agency for Medical Research and Development (RO), and research grants from the Research Grant of the Princess Takamatsu Cancer Research Fund (RO) and the Mitsubishi Foundation (to RO).
Suzuki S, Tsutsumi S, Chen Y, et al. Identification and characterization of the binding sequences and target genes of p53 lacking the 1st transactivation domain. Cancer Sci. 2020;111:451–466. 10.1111/cas.14279
Suzuki, Tsutsumi and Chen equally contributed to this work.
Funding information
Ministry of Education, Culture, Sports, Science and Technology of Japan (Grant/Award Number: 19K16732), the Ministry of Education, Culture, Sports, Science and Technology of Japan (Grant/Award Number: 17H03587) and the Ministry of Health, Labour and Welfare.
REFERENCES
- 1. Levine AJ, Oren M. The first 30 years of p53: growing ever more complex. Nat Rev Cancer. 2009;9:749‐758. [DOI] [PMC free article] [PubMed] [Google Scholar]
- 2. Vousden KH, Prives C. Blinded by the light: the growing complexity of p53. Cell. 2009;137:413‐431. [DOI] [PubMed] [Google Scholar]
- 3. Bieging KT, Mello SS, Attardi LD. Unravelling mechanisms of p53‐mediated tumour suppression. Nat Rev Cancer. 2014;14:359‐370. [DOI] [PMC free article] [PubMed] [Google Scholar]
- 4. Sullivan KD, Galbraith MD, Andrysik Z, Espinosa JM. Mechanisms of transcriptional regulation by p53. Cell Death Differ. 2018;25:133‐143. [DOI] [PMC free article] [PubMed] [Google Scholar]
- 5. Venot C, Maratrat M, Sierra V, Conseiller E, Debussche L. Definition of a p53 transactivation function‐deficient mutant and characterization of two independent p53 transactivation subdomains. Oncogene. 1999;18:2405‐2410. [DOI] [PubMed] [Google Scholar]
- 6. Bourdon JC, Fernandes K, Murray‐Zmijewski F, et al. p53 isoforms can regulate p53 transcriptional activity. Genes Dev. 2005;19:2122‐2137. [DOI] [PMC free article] [PubMed] [Google Scholar]
- 7. Yin Y, Stephen CW, Luciani MG, Fahraeus R. p53 Stability and activity is regulated by Mdm2‐mediated induction of alternative p53 translation products. Nat Cell Biol. 2002;4:462‐467. [DOI] [PubMed] [Google Scholar]
- 8. Courtois S, Verhaegh G, North S, et al. DeltaN‐p53, a natural isoform of p53 lacking the first transactivation domain, counteracts growth suppression by wild‐type p53. Oncogene. 2002;21:6722‐6728. [DOI] [PubMed] [Google Scholar]
- 9. Ghosh A, Stewart D, Matlashewski G. Regulation of human p53 activity and cell localization by alternative splicing. Mol Cell Biol. 2004;24:7987‐7997. [DOI] [PMC free article] [PubMed] [Google Scholar]
- 10. Ray PS, Grover R, Das S. Two internal ribosome entry sites mediate the translation of p53 isoforms. EMBO Rep. 2006;7:404‐410. [DOI] [PMC free article] [PubMed] [Google Scholar]
- 11. Candeias MM, Powell DJ, Roubalova E, et al. Expression of p53 and p53/47 are controlled by alternative mechanisms of messenger RNA translation initiation. Oncogene. 2006;25:6936‐6947. [DOI] [PubMed] [Google Scholar]
- 12. Ohki R, Kawase T, Ohta T, Ichikawa H, Taya Y. Dissecting functional roles of p53 N‐terminal transactivation domains by microarray expression analysis. Cancer Sci. 2007;98:189‐200. [DOI] [PMC free article] [PubMed] [Google Scholar] [Retracted]
- 13. Zhu J, Zhang S, Jiang J, Chen X. Definition of the p53 functional domains necessary for inducing apoptosis. J Biol Chem. 2000;275:39927‐39934. [DOI] [PubMed] [Google Scholar]
- 14. Bourougaa K, Naski N, Boularan C, et al. Endoplasmic reticulum stress induces G2 cell‐cycle arrest via mRNA translation of the p53 isoform p53/47. Mol Cell. 2010;38:78‐88. [DOI] [PubMed] [Google Scholar]
- 15. Brady CA, Jiang D, Mello SS, et al. Distinct p53 transcriptional programs dictate acute DNA‐damage responses and tumor suppression. Cell. 2011;145:571‐583. [DOI] [PMC free article] [PubMed] [Google Scholar]
- 16. Jiang D, Brady CA, Johnson TM, et al. Full p53 transcriptional activation potential is dispensable for tumor suppression in diverse lineages. Proc Natl Acad Sci U S A. 2011;108:17123‐17128. [DOI] [PMC free article] [PubMed] [Google Scholar]
- 17. Maier B, Gluba W, Bernier B, et al. Modulation of mammalian life span by the short isoform of p53. Genes Dev. 2004;18:306‐319. [DOI] [PMC free article] [PubMed] [Google Scholar]
- 18. Phang BH, Othman R, Bougeard G, et al. Amino‐terminal p53 mutations lead to expression of apoptosis proficient p47 and prognosticate better survival, but predispose to tumorigenesis. Proc Natl Acad Sci U S A. 2015;112:E6349‐E6358. [DOI] [PMC free article] [PubMed] [Google Scholar]
- 19. Lambert PF, Kashanchi F, Radonovich MF, Shiekhattar R, Brady JN. Phosphorylation of p53 serine 15 increases interaction with CBP. J Biol Chem. 1998;273:33048‐33053. [DOI] [PubMed] [Google Scholar]
- 20. Li AG, Piluso LG, Cai X, Gadd BJ, Ladurner AG, Liu X. An acetylation switch in p53 mediates holo‐TFIID recruitment. Mol Cell. 2007;28:408‐421. [DOI] [PubMed] [Google Scholar]
- 21. Ohki R, Nemoto J, Murasawa H, et al. Reprimo, a new candidate mediator of the p53‐mediated cell cycle arrest at the G2 phase. J Biol Chem. 2000;275:22627‐22630. [DOI] [PubMed] [Google Scholar]
- 22. Asano Y, Kawase T, Okabe A, et al. IER5 generates a novel hypo‐phosphorylated active form of HSF1 and contributes to tumorigenesis. Sci Rep. 2016;6:19174. [DOI] [PMC free article] [PubMed] [Google Scholar]
- 23. Chen Y, Takikawa M, Tsutsumi S, et al. PHLDA1, another PHLDA family protein that inhibits Akt. Cancer Sci. 2018;109:3532‐3542. [DOI] [PMC free article] [PubMed] [Google Scholar]
- 24. Kawase T, Ohki R, Shibata T, et al. PH domain‐only protein PHLDA3 is a p53‐regulated repressor of Akt. Cell. 2009;136:535‐550. [DOI] [PubMed] [Google Scholar]
- 25. Burns TF, Fei P, Scata KA, Dicker DT, El‐Deiry WS. Silencing of the novel p53 target gene Snk/Plk2 leads to mitotic catastrophe in paclitaxel (taxol)‐exposed cells. Mol Cell Biol. 2003;23:5556‐5571. [DOI] [PMC free article] [PubMed] [Google Scholar]
- 26. Min SH, Kim DM, Heo YS, et al. New p53 target, phosphatase of regenerating liver 1 (PRL‐1) downregulates p53. Oncogene. 2009;28:545‐554. [DOI] [PubMed] [Google Scholar]
- 27. He H, Sun Y. Ribosomal protein S27L is a direct p53 target that regulates apoptosis. Oncogene. 2007;26:2707‐2716. [DOI] [PubMed] [Google Scholar]
- 28. Li J, Tan J, Zhuang L, et al. Ribosomal protein S27‐like, a p53‐inducible modulator of cell fate in response to genotoxic stress. Cancer Res. 2007;67:11317‐11326. [DOI] [PubMed] [Google Scholar]
- 29. Oda K, Arakawa H, Tanaka T, et al. p53AIP1, a potential mediator of p53‐dependent apoptosis, and its regulation by Ser‐46‐phosphorylated p53. Cell. 2000;102:849‐862. [DOI] [PubMed] [Google Scholar]
- 30. Taira N, Nihira K, Yamaguchi T, Miki Y, Yoshida K. DYRK2 is targeted to the nucleus and controls p53 via Ser46 phosphorylation in the apoptotic response to DNA damage. Mol Cell. 2007;25:725‐738. [DOI] [PubMed] [Google Scholar]
- 31. Zhu J, Zhou W, Jiang J, Chen X. Identification of a novel p53 functional domain that is necessary for mediating apoptosis. J Biol Chem. 1998;273:13030‐13036. [DOI] [PubMed] [Google Scholar]
- 32. Townsend PA, Scarabelli TM, Davidson SM, Knight RA, Latchman DS, Stephanou A. STAT‐1 interacts with p53 to enhance DNA damage‐induced apoptosis. J Biol Chem. 2004;279:5811‐5820. [DOI] [PubMed] [Google Scholar]
- 33. Trainor CD, Mas C, Archambault P, Di Lello P, Omichinski JG. GATA‐1 associates with and inhibits p53. Blood. 2009;114:165‐173. [DOI] [PMC free article] [PubMed] [Google Scholar]
- 34. Bessette DC, Qiu D, Pallen CJ. PRL PTPs: mediators and markers of cancer progression. Cancer Metastasis Rev. 2008;27:231‐252. [DOI] [PubMed] [Google Scholar]
- 35. Rios P, Li X, Kohn M. Molecular mechanisms of the PRL phosphatases. FEBS J. 2013;280:505‐524. [DOI] [PubMed] [Google Scholar]
- 36. Bai Y, Luo Y, Liu S, et al. PRL‐1 protein promotes ERK1/2 and RhoA protein activation through a non–canonical interaction with the Src homology 3 domain of p115 Rho GTPase‐activating protein. J Biol Chem. 2011;286:42316‐42324. [DOI] [PMC free article] [PubMed] [Google Scholar]
- 37. Sacchetti C, Bai Y, Stanford SM, et al. PTP4A1 promotes TGFbeta signaling and fibrosis in systemic sclerosis. Nat Commun. 2017;8:1060. [DOI] [PMC free article] [PubMed] [Google Scholar]
- 38. Salvi M, Trashi E, Cozza G, Franchin C, Arrigoni G, Pinna LA. Investigation on PLK2 and PLK3 substrate recognition. Biochim Biophys Acta. 2012;1824:1366‐1373. [DOI] [PubMed] [Google Scholar]
- 39. Xiong X, Zhao Y, Tang F, et al. Ribosomal protein S27‐like is a physiological regulator of p53 that suppresses genomic instability and tumorigenesis. Elife. 2014;3:e02236. [DOI] [PMC free article] [PubMed] [Google Scholar]
Associated Data
This section collects any data citations, data availability statements, or supplementary materials included in this article.
Supplementary Materials


