Figure 3.

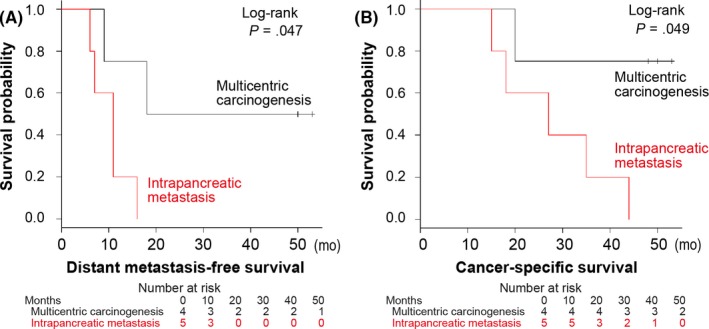
Kaplan‐Meier curves for distant metastasis‐free survival (A) and cancer‐specific survival (B) according to two pathogenic pathways. Tables show the number of patients who remained alive and at risk of the event at each time point

Kaplan‐Meier curves for distant metastasis‐free survival (A) and cancer‐specific survival (B) according to two pathogenic pathways. Tables show the number of patients who remained alive and at risk of the event at each time point