Figure 5.

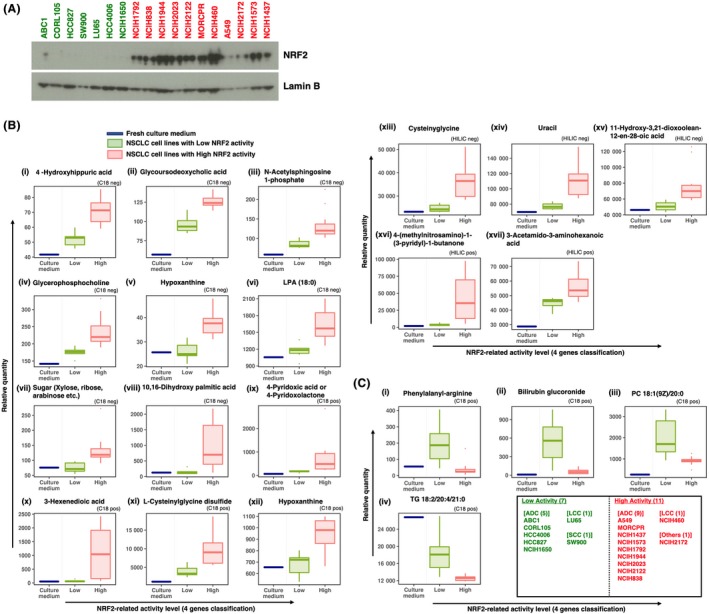
G‐Met analysis of 18 NSCLC cell lines using UHPLC‐QTOF/MS and LC‐FTMS. A, Immunoblot analysis of NRF2 in 18 NSCLC cell lines. Lamin B was detected as a loading control. NRF2‐high and NRF2‐low cells are shown in red and green, respectively. B and C, Box plots of metabolites significantly higher (B) or lower (C) in the culture supernatants of NRF2‐high NSCLC cell lines than in those of NRF2‐low NSCLC cell lines according to expression rankings of 4 NRF2 target genes. Boxes represent the interquartile range (IQR) between first quantile (Q1) and third quartiles (Q3). Lines inside the boxes represent the median, whiskers denote the lowest and highest values within 1.5 × IQR from the Q1 and Q3, respectively, and dots represent outliers beyond the whiskers. Analytical modes using a C18 column or HILIC column in positive ion mode and negative ion mode are shown on each graph as C18 pos, C18 neg, HILIC pos and HILIC neg. LPA, lysophosphatidic acid; PC, phosphatidylcholine; TG, triglyceride
