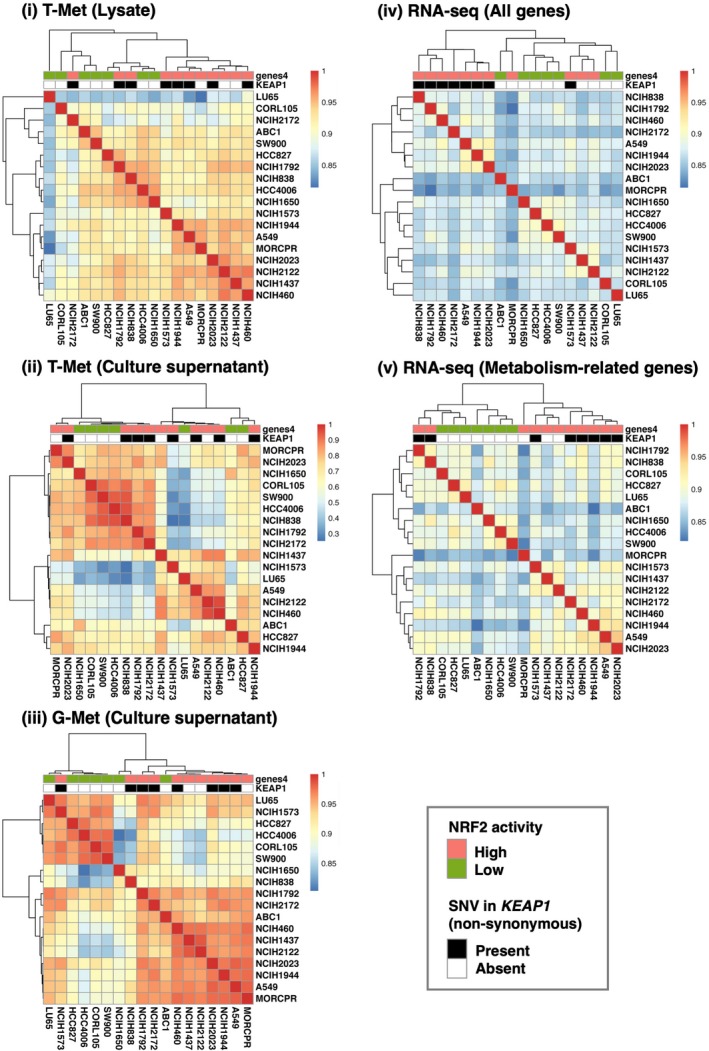
Figure 7.

Heat map and hierarchical clustering of 18 cell lines. Similarity between NSCLC cell lines is defined as the Spearman correlation coefficient calculated from the profiles of each analysis. Color codes indicate values of Spearman correlation coefficients. The 18 cell lines are labeled according to the NRF2 activation status and KEAP1 mutation status
