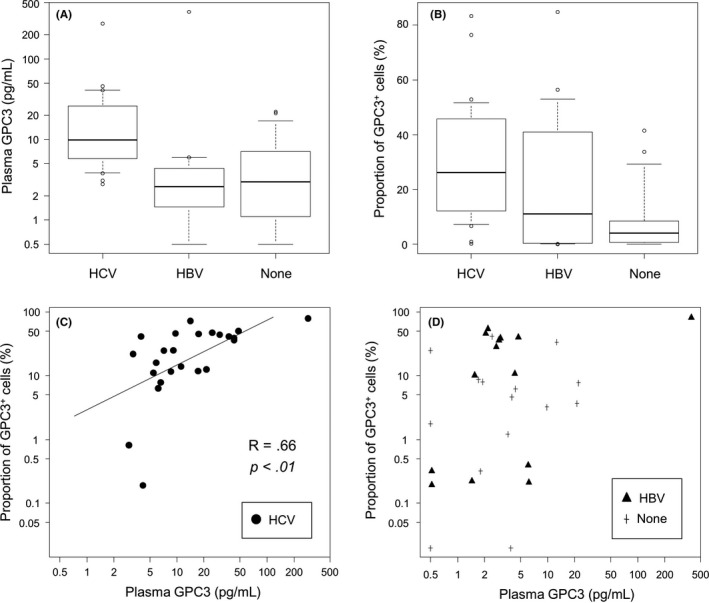
Figure 1.

Analysis of plasma glypican‐3 (GPC3) levels and proportions of GPC3+ cells among each virus group. A, Box plot of plasma GPC3 levels across virus types. B, Box plot of proportions of GPC3+ cells across virus types. C, Correlation between plasma GPC3 levels and proportions of GPC3+ cells in the hepatitis C virus (HCV) group, and (D) in other groups. HBV, hepatitis B virus
