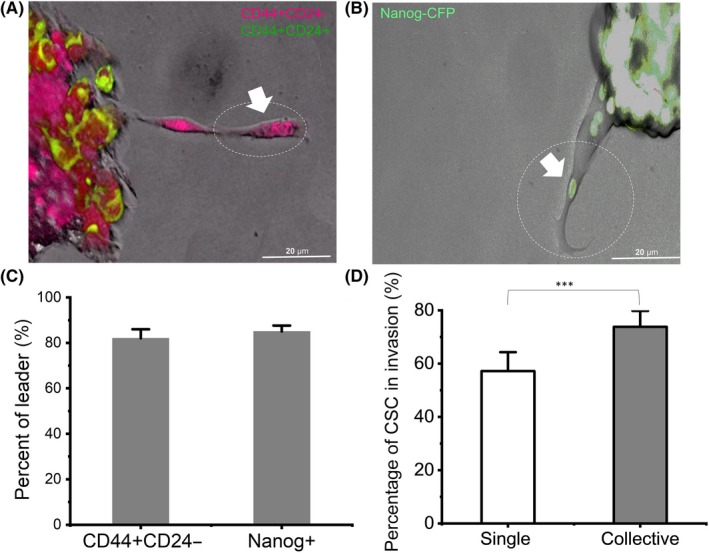
Figure 3.

Cancer stem‐like cells (CSC) led collective or single invasion. A and B, Confocal magnified view of the collective strand. The white arrow points to the leader cell in the circle. C, Percentage of CD44+CD24− and Nanog+ cells in leader position of collective strands. D, Percentage of single and collective invasive cells in CSC. n = 72 spheroids. Data are presented as the means ± SD (n = 3). All P‐values were determined by Student’s t test. *P < 0.05. **P < 0.01. ***P < 0.001
