
Figure 4.
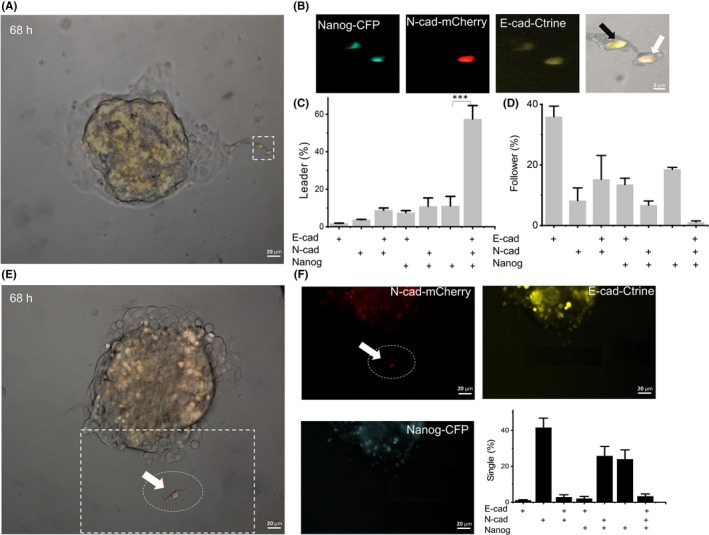
The collective invasive leader cells showed hybrid E/M expression characteristics. A, After 68 h, collective invasion with pE‐cad‐Ctrine, pN‐cad‐mCherry and pNanog‐CFP labeled cells. B, The pictures show the magnified picture in the white box of (A), which is collective invasion. The white arrow indicates the leader and the black arrow indicates the follower. C and D, Dhta show the percentage of positive expression of different genes in leader cells and follower cells. + is positive for relative gene expression; n = 200 cells from 72 spheroids. E, After 68 h, single invasion with pE‐cad‐Ctrine, pN‐cad‐mCherry and pNanog‐CFP labeled cells. F, The pictures show the white box in (E), which is the single invasion. The white arrow indicates the N‐cadherin+ of single invasive cells. Data show that the percentage of positive expression of different genes in single invasive cells. n = 200 cells from 72 spheroids. Data are presented as the means ± SD (n = 3). All P‐values were determined by Student’s t test. *P < 0.05. **P < 0.01. ***P < 0.001