
Figure 5.
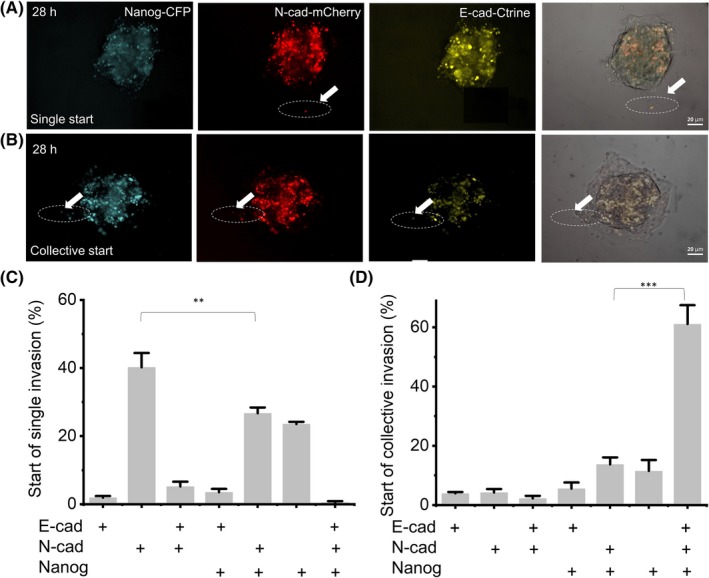
The difference of E/M phenotype expression varies at the beginning of different invasive behaviors. A and B, At 28 h, single invasion (A) and collective invasion (B) with pE‐cad‐Ctrine, pN‐cad‐mCherry and pNanog‐CFP labeled cells. The white arrow indicates the starting cell of invasion. C and D, + is positive gene expression in invasive leader cells. Data show the percentage of positive expression of different genes in starting cells of single (C) and collective (D) invasion; n = 200 cells from 72 spheroids of three independent experiments. Data are presented as the means ± SD (n = 3). All P‐values were determined by Student’s t test. *P < 0.05. **P < 0.01. ***P < 0.001