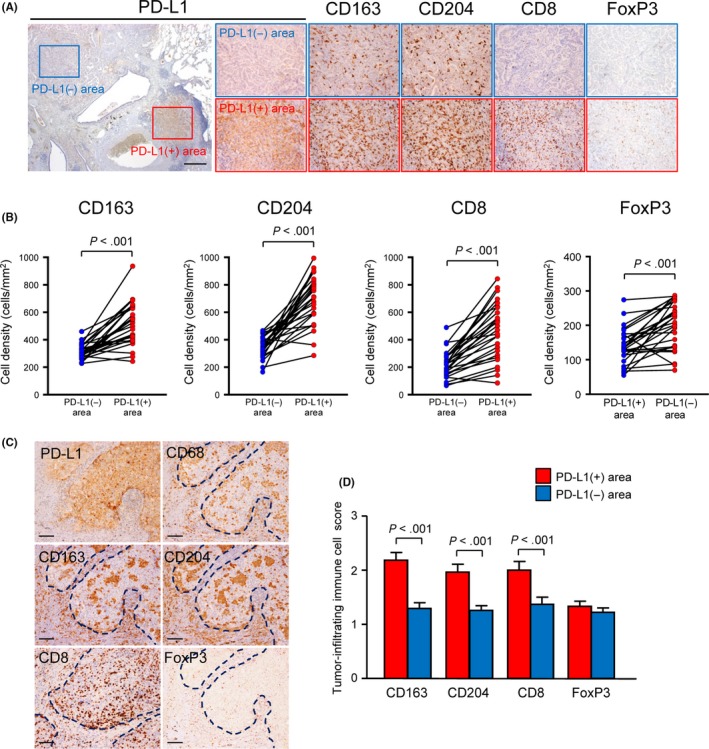
Figure 3.

Relationship between heterogeneity of tumor programmed death‐ligand 1 (PD‐L1) expression status and immune cell infiltration densities/patterns within the tumor. A, Representative images of immunohistochemical staining for PD‐L1, CD163, CD204, CD8 or FoxP3 in PD‐L1‐low/no (PD‐L1−) or PD‐L1‐high (PD‐L1+) expression areas in PD‐L1‐positive invasive adenocarcinoma. The PD‐L1‐stained section is shown in the left panel and the rectangle PD‐L1− and PD‐L1+ areas are magnified to the right. Scale bars, 500 μm. B, Association between tumor PD‐L1 expression status and the densities of CD163‐, CD204‐, CD8‐ or FoxP3‐immunostained immune cells within the tumor (n = 27). A paired Student t test was performed. C, Representative images of PD‐L1+ carcinoma cell nests immunostained for PD‐L1, CD68, CD163, CD204, CD8 or FoxP3. Note that CD163+ or CD204+ TAM and CD8+ T cells were accumulated in PD‐L1+ carcinoma cell nests, whereas FoxP3+ T cells were mainly observed in the tumor stroma, even in PD‐L1+ areas. Dotted lines indicate PD‐L1+ cancer cell nests. Scale bar, 100 μm. D, Comparison of tumor‐infiltrating immune cell scores between PD‐L1− and PD‐L1+ areas within the tumor (n = 27). The tumor‐infiltrating immune cell score was defined as described in “Section 2”. A paired Student t test was performed
