
Figure 1.
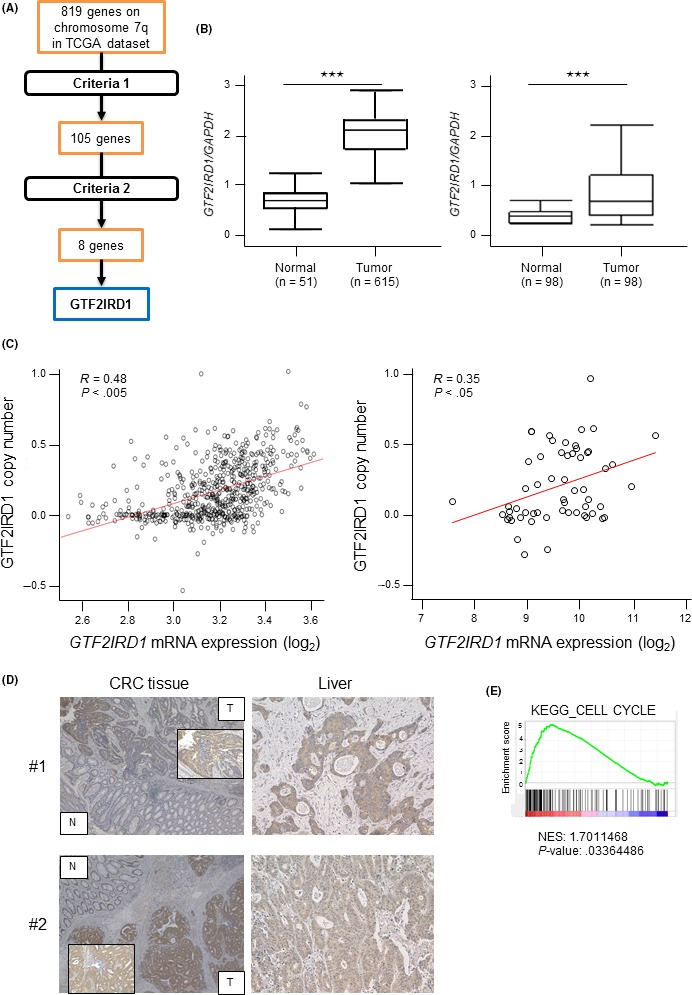
Identification of candidate oncogenes on chromosome 7q in colorectal cancer (CRC). A, Schematic diagram of the strategy for candidate oncogene selection. Criteria 1: Positive correlations between DNA copy numbers and mRNA expression levels (cut‐off correlation coefficient, 0.4). Criteria 2: Overexpressed in tumor tissues compared with normal tissues (>2‐fold change). B, Left, GTF2IRD1 mRNA expression between 615 CRC tissues and 51 normal colon tissues in The Cancer Genome Atlas (TCGA) dataset. Right, GTF2IRD1 mRNA expression in 98 CRC tissues and paired normal colon tissues in our dataset by RT‐quantitative PCR. ***P < .0005. C, Left, Correlation between GTF2IRD1 copy number and GTF2IRD1 mRNA expression in TCGA dataset. Right, Correlation between GTF2IRD1 copy number and GTF2IRD1 mRNA expression in the Cancer Cell Line Encyclopedia dataset. R, Pearson’s correlation coefficient. D, Immunohistochemical staining for GTF2IRD1 in normal colon and tumor tissues (left), and liver metastatic lesion tissues (right) in the same patients. Original magnification, 40× and 200×. E, Gene set enrichment analysis of the expression of GTF2IRD1 and cell cycle‐related genes using reference gene sets in the CRC dataset. KEGG, Kyoto Encyclopedia of Genes and Genomes; N, normal tissue; NES, Normalized Enrichment Score; T, tumor tissue