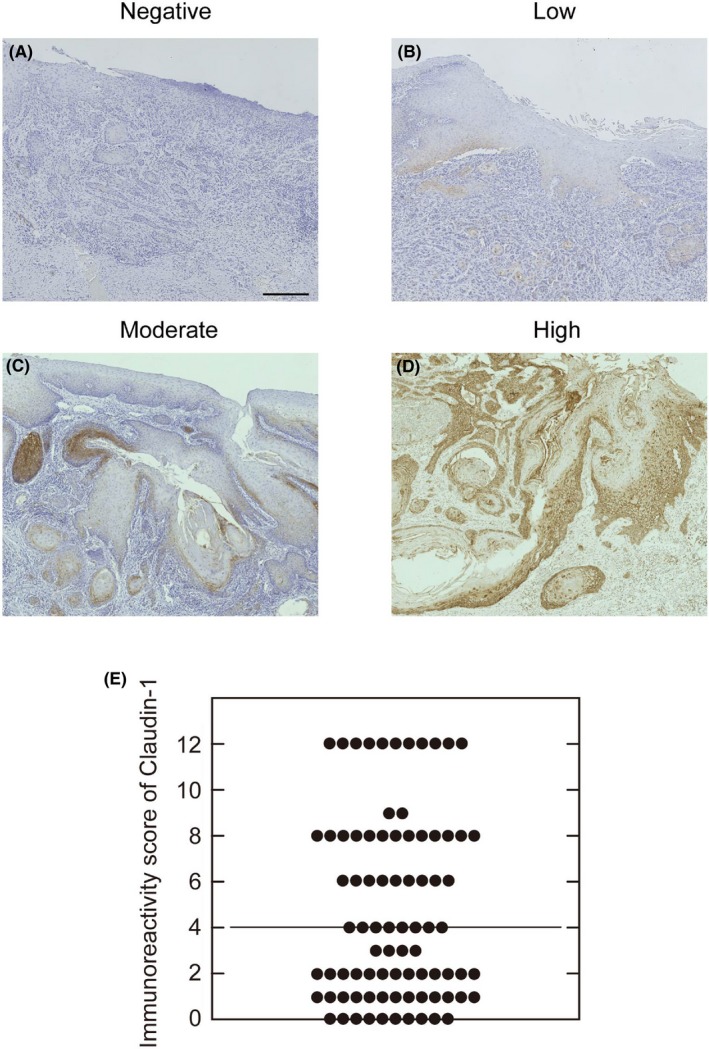
Figure 1.

Representative photomicrographs of claudin‐1 immunohistochemistry in tongue squamous cell carcinoma (TSCC). A‐D, Immunoreactivity intensities were categorized into negative (score 0), low (score 1), moderate (score 2), and high (score 3). Scale bars, 300 μm. E, Distribution of the final scores of claudin‐1 immunoreactivity (dimensionless) in TSCC (n = 83) obtained by multiplying the proportion score by the intensity score. Horizontal line shows the median value. Cases were classified into high‐ and low‐expression groups, with final scores of 4 or more and 3 or less, respectively
