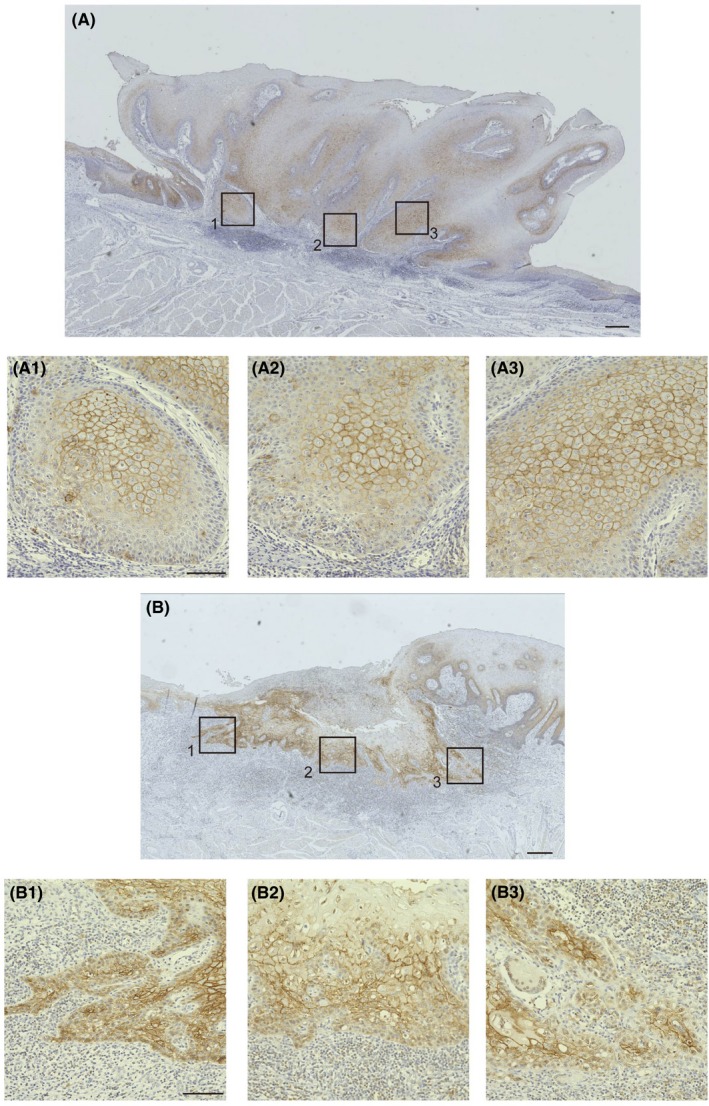
Figure 3.

Assessment of tongue squamous cell carcinoma according to membrane localization of claudin‐1 at the invasion front. For assessment of claudin‐1 localization, five square regions were selected from the claudin‐1 positive invasion front for each case. The case was classified as “membrane” when exclusive membrane localization of claudin‐1 was observed based on immunohistochemical staining in more than three regions. This figure shows examples of membrane localization of claudin‐1. Three boxed areas out of five in (A, B) are magnified (A‐1/A‐2/A‐3, B‐1/B‐2/B‐3), respectively, and show the membrane localization of claudin‐1. Scale bars, 300 μm (A, B) and 100 μm (A‐1/A‐2/A‐3, B‐1/B‐2/B‐3). The case shown in Figure 3A is the same as that in Figure 2F‐H
