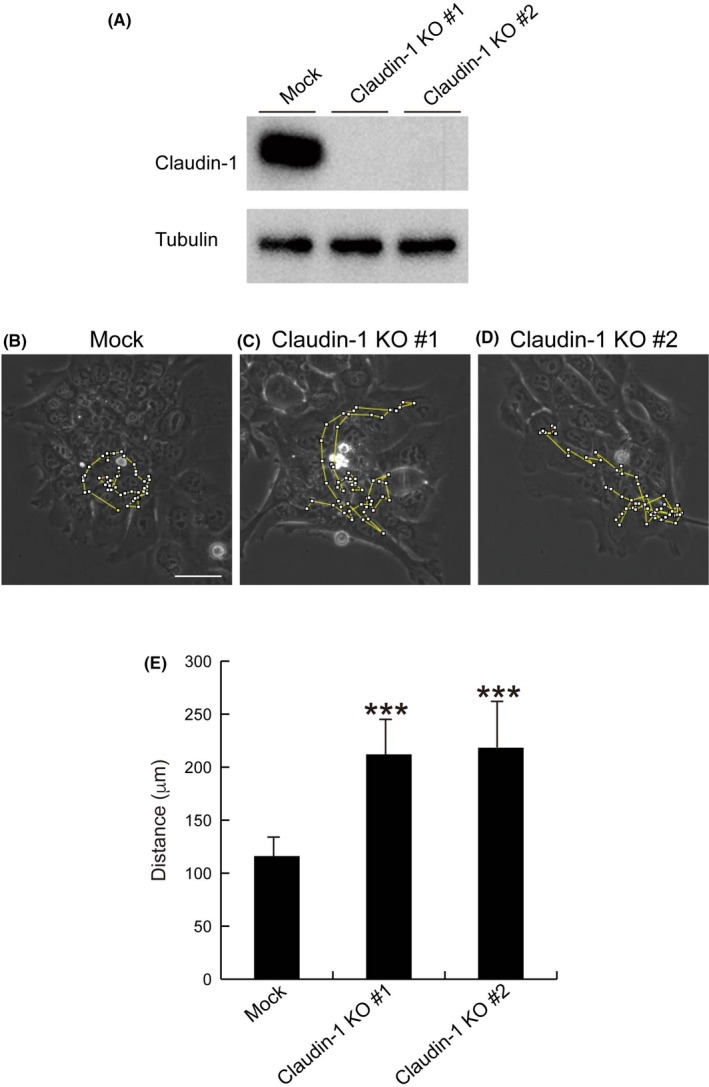
Figure 7.

Deficiency of claudin‐1 promotes motility of SAS cells based on cell motility analysis. A, Claudin‐1 expression in mock or claudin‐1‐knockout SAS cells (generated by gRNA #1 and gRNA #2) was determined by immunoblotting. B‐D, Mock or claudin‐1‐knockout SAS cells (generated by gRNA #1 and gRNA #2) were seeded in 6‐well plates (2 × 10⁴ cells/well). After 48 h, cell motility was recorded. Representative random moving traces of 61 cells during a 10‐min recoding period over 10 h are presented. Scale bar, 50 μm. (E) Summarized data of the migrated distances within 10 h. Data are expressed as means + SD (n = 10). Student’s t test with two biological independent replicates was used to determine statistical significance; ***P < .001, compared with control
