. 2020 Jan 28;9:e52228. doi: 10.7554/eLife.52228

Figure 1. Spontaneous activity of IC neurons is modulated by locomotion.

(A-B) Example recordings of spontaneous activity in IC neurons. During walking periods, the neuron in A increased firing (from 7.6 Hz to 21.6 Hz), whereas the neuron in B decreased firing (from 19.1 Hz to 8.2 Hz). In both cases, the smoothed firing rates (black middle traces) exhibit significant correlations with the speed of the treadmill (green traces) (A: r = 0.59; B: r = −0.24). Thick black lines above the neural records indicate walking periods. (C) Population plot comparing average spontaneous firing rates between stationary and walking conditions (n = 96 neurons). Red circles: increased, blue: decreased, black: no significant change in firing. Values for the example neurons in A (cross) and B (triangle) are also shown. (D) Histogram of correlation coefficients between smoothed firing rate and speed (color code as in C). (E) Photomicrograph of a Nissl section with lesion sites marked with red arrow heads (scale bar = 1 mm), and reconstructed recording locations are shown in two transverse sections (5.0 and 5.2 mm posterior to the bregma, respectively). Color code as in C.

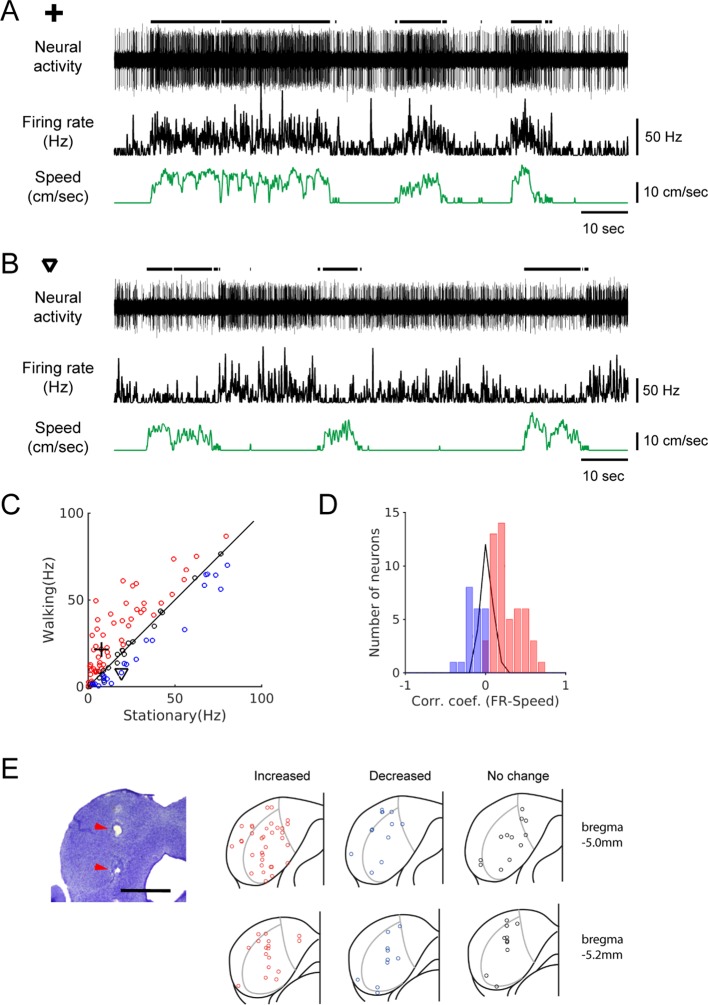
Figure 1—source data 1. Source data for spontaneous activity modulation, and walking sound recording and playback.
elife-52228-fig1-data1.xlsx (257.1KB, xlsx)

Figure 1.

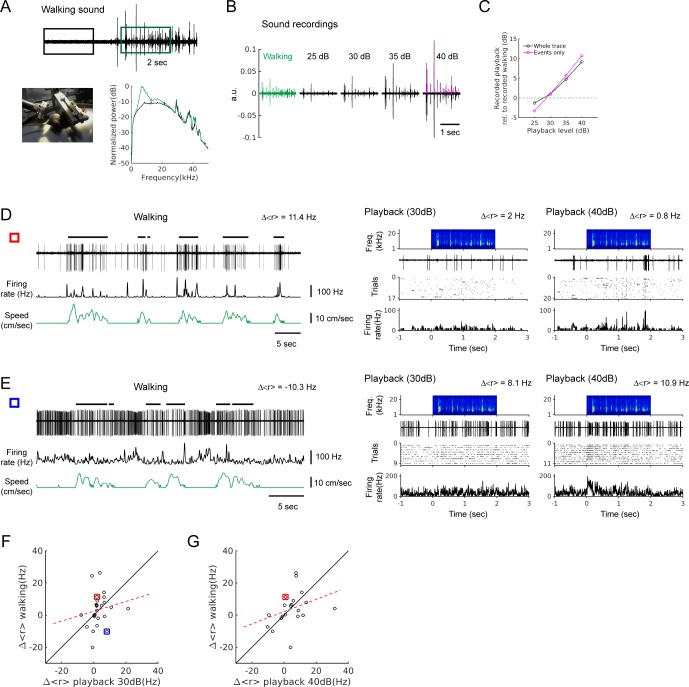
Figure 1—figure supplement 1. Recording of walking sounds and playback responses.

Figure 1—figure supplement 1.

(A) Top: walking sound recording in sound pressure waveforms (black and green boxes denote 2 sec periods during baseline and walking, respectively, used for power spectrum calculation and playback). Bottom left: picture of the recording setup. Bottom right: normalized power spectrum (black trace: baseline, green trace: walking). (B) Recordings of walking sound (green), and walking sound playback at different sound levels (25, 30, 35, and 40 dB). The playback sound levels were determined from RMS values of thresholded events shown as magenta in the 40 dB waveform. (C) Sound levels of recorded playbacks in B, relative to the level of the walking sound recording (horizontal green dashed line). Sound levels were obtained from whole traces (black) or only from the events (magenta), In both cases, the recording of 30 dB playback was the closest to that of walking sounds. The same events were used for all playback levels and walking sound recording. (D) Example neuron showing a strong positive modulation during locomotion (left; ∆<r> = 11.4 Hz), but weak responses to playback (right; ∆<r> = 2.0 Hz at 30 dB, and ∆<r> = 0.8 Hz at 40 dB). (E) Example neuron showing a suppression during locomotion (left; ∆<r> = −10.3 Hz), but excitatory responses to playback (right, ∆<r> = 8.1 Hz at 30 dB and ∆<r> = 10.9 Hz at 40 dB; in this example, the first 0.5 s of the stimulus period was excluded for firing rate measurement due to the response during the initial baseline period). (F) Average firing rate changes (∆<r> ) during locomotion vs. the changes by walking sound playback at 30 dB (n = 25; r = 0.16, p=0.44). Red and blue squares represent the neurons in D and E, respectively. (G) Same as F, but for playback at 40 dB (n = 20, five neurons excluded due to substantial responses to the recording baseline; r = 0.33, p=0.15). Red square is the neuron in D. The neuron in E was one of the five excluded neurons.