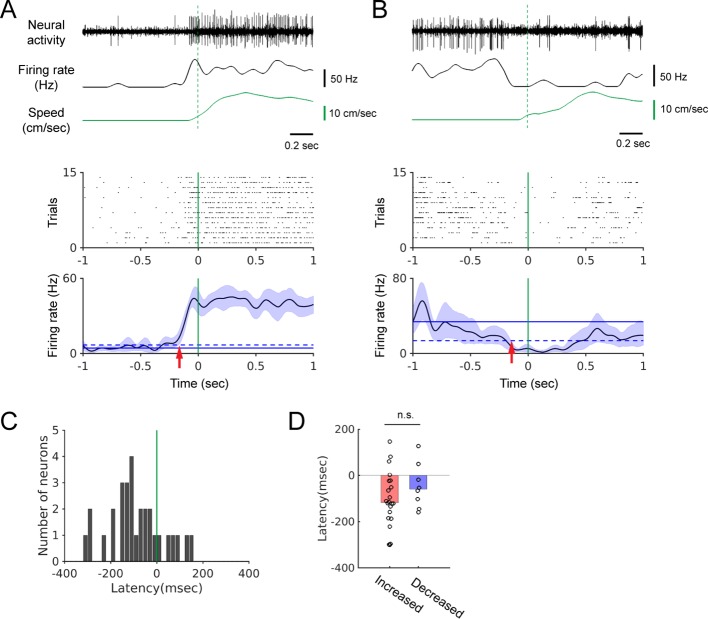
Figure 2. The onset of firing rate modulation precedes locomotion onset.
(A-B) Top: Example neural recordings, corresponding smoothed firing rates, and walking speed. Bottom: Spike rasters aligned at the onset of walking and the locomotion onset-triggered averages of firing rates. Blue shading indicates the 95% confidence interval of the average firing rates. Horizontal solid and dashed lines show the average spontaneous firing rate and the 2x standard deviation above (A) or below (B) the average, respectively. Vertical green lines indicate locomotion onset. Red arrows indicate modulation onset. (C) Histogram of the neural modulation latencies relative to locomotion onset (n = 30). Time zero indicates locomotion onset. (D) Modulation latencies for neurons with increased (red bar, n = 22) and decreased (blue bar, n = 8) firing during locomotion (Wilcoxon rank sum test, p=0.25). Bar graphs show the median latencies.

