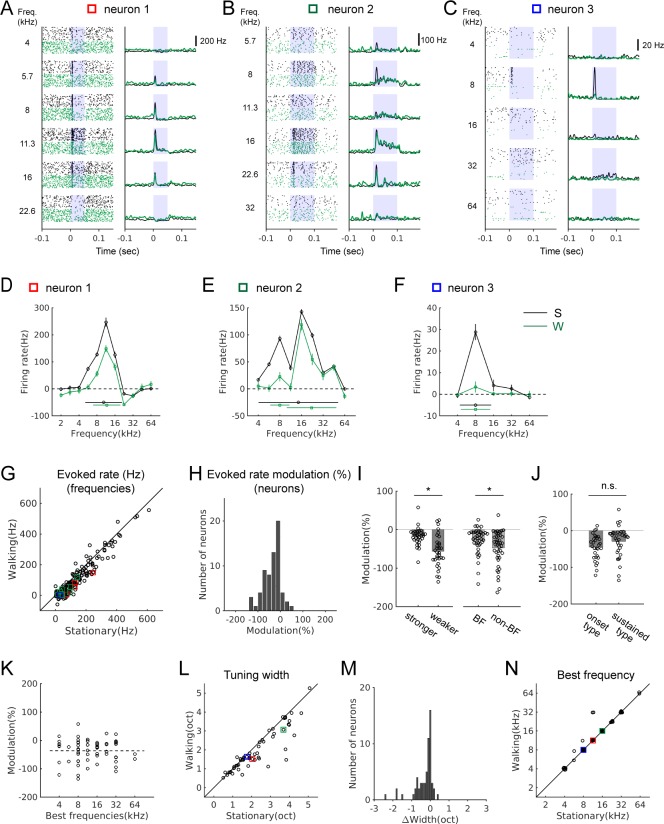
Figure 4. Sound-evoked activity of IC neurons is attenuated during locomotion.
(A-C) Tone-evoked responses from three example IC neurons. Black spike rasters and PSTHs are from stationary trials, and green from walking trials. In each neuron, the same number of trials is shown for each condition (A: 35 trials; B: 25 trials; C: 92 trials). Blue shading indicates the period of sound stimulus presentation. Squares in different colors indicate the data points corresponding to the examples in the population plots in G, L, and N. (D-F) Tuning curves (black: stationary, green: walking) based on baseline-subtracted average firing rates at stimulus onset (see Materials and methods). Tuning widths are shown as horizontal bars in each condition (with the centroid shown as a circle at the center). The tuning curves are from the neurons shown in A-C, respectively. (G) Comparison of evoked rates between the stationary and walking conditions at all frequencies with excitatory responses (178 tones, 65 neurons). Values from the example neurons in A-C are indicated as squares in corresponding colors. (H) Histogram of percent evoked-rate modulation across the recorded neurons (n = 65). One-sample t-test for the zero mean, p=1.4×10⁻¹⁰. (I) Comparison of the percent evoked-rate modulation between neurons with weaker and stronger responses (the left two bars; stronger: above the median, n = 33; weaker: below the median, n = 32; t-test, p=0.0175), or between best and non-best frequencies (BF vs. non-BF) (the right two bars; n = 43 of 65 neurons that had responses at both best and non-best frequencies; paired t-test, p=6.98×10⁻⁴). Each data point denotes a neuron. (J) Percent evoked-rate modulation in neurons with responses only at the onset vs. neurons with sustained responses (onset type: n = 30; sustained type: n = 35; t-test, p=0.103). (K) Scatter plot of percent evoked-rate modulation as a function of best frequencies (n = 65; r = −0.0031, p=0.98). (L) Frequency tuning widths in octaves for stationary and walking conditions. (M) Histogram of tuning width changes (n = 60, one sample Wilcoxon signed rank test, p=3.0×10⁻⁷; mean change = −0.29 octaves). (N) Comparison of best frequencies (n = 60). In L-N, neurons that lost all excitatory responses in the walking condition, yielding the tuning width of 0, were not included (n = 5).


