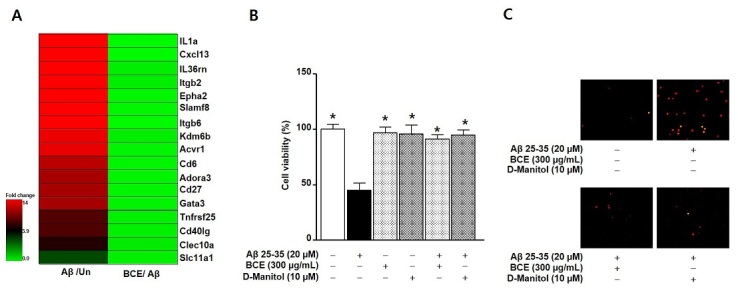
Figure 3. Transcriptomic profiles and cell viability in response to BCE treatment in Aβ-induced primary neuron cell death. (A) Hierarchical clustering of microarray data obtained from BCE-treated (with 300 μg/mL) amyloid beta (Aβ)-stimulated primary neuronal cells. (B) The primary neuronal cells (1 × 10⁵) were treated with Aβ 25-35 (20 uM), with or without BCE (300 μg/mL) for 24 h. Bar graphs indicate the percentage of cell viability. Data are expressed as the mean ± SE values from three independent experiments. *P < 0.05 compared to only Aβ 25-35 treated group. (C) The Live/Dead cell reagents were dispensed into each well, and these images were acquired using a fluorescence microscope (excitation 580 nm and emission 604 nm). Un: untreated group; BCE: black chokeberry ethanol extract treated group; Aβ: amyloid β treated group.

