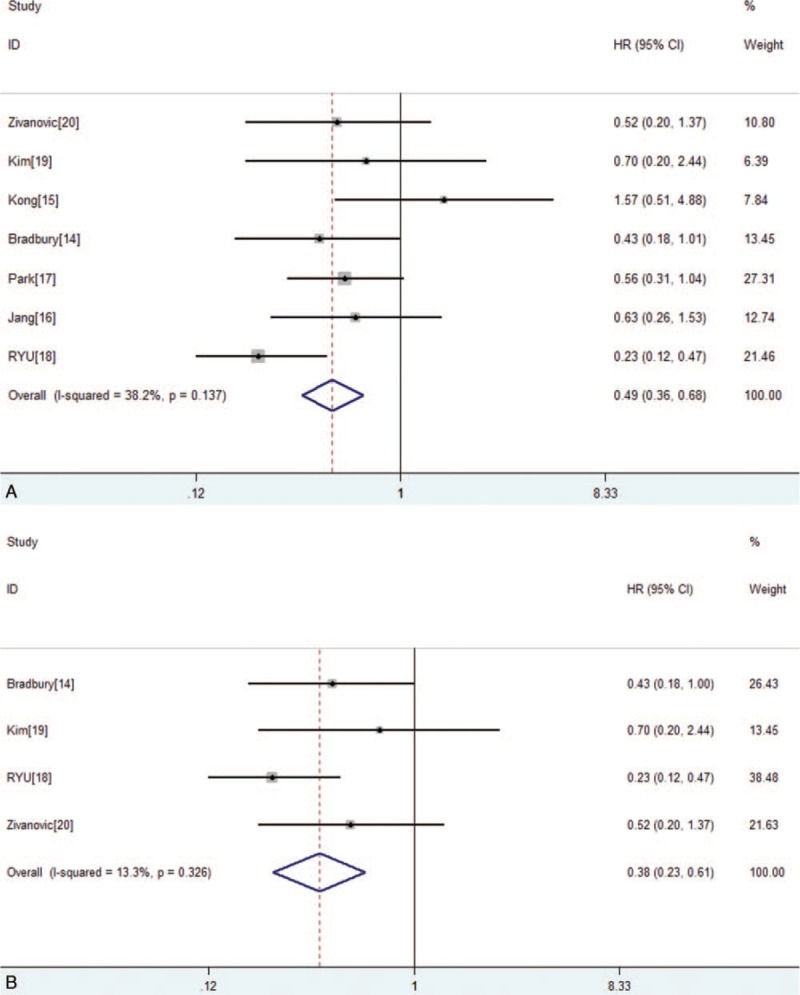
Figure 2.

(A) Forest plot of the hazard ratios of overall survival (OS) between the radical hysterectomy (RH) group and chemoradiotherapy (CRT) group in all papers. (B) Forest plot of the hazard ratios of OS between the RH group and CRT group in stage IB2 patients. CI = confidence interval, HR = hazard ratio.
