Figure 1.

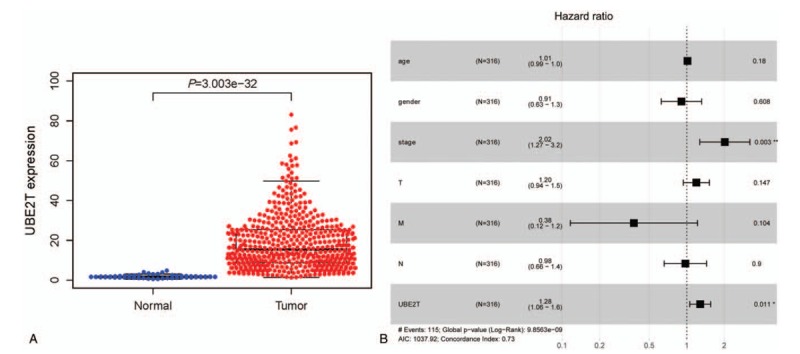
(A) The scatter plot showed the difference of UBE2T expression between normal and tumor samples (P < .01). (B) The forest plot about the multivariate analysis results. UBE2T = ubiquitin conjugating enzyme E2 T.

(A) The scatter plot showed the difference of UBE2T expression between normal and tumor samples (P < .01). (B) The forest plot about the multivariate analysis results. UBE2T = ubiquitin conjugating enzyme E2 T.