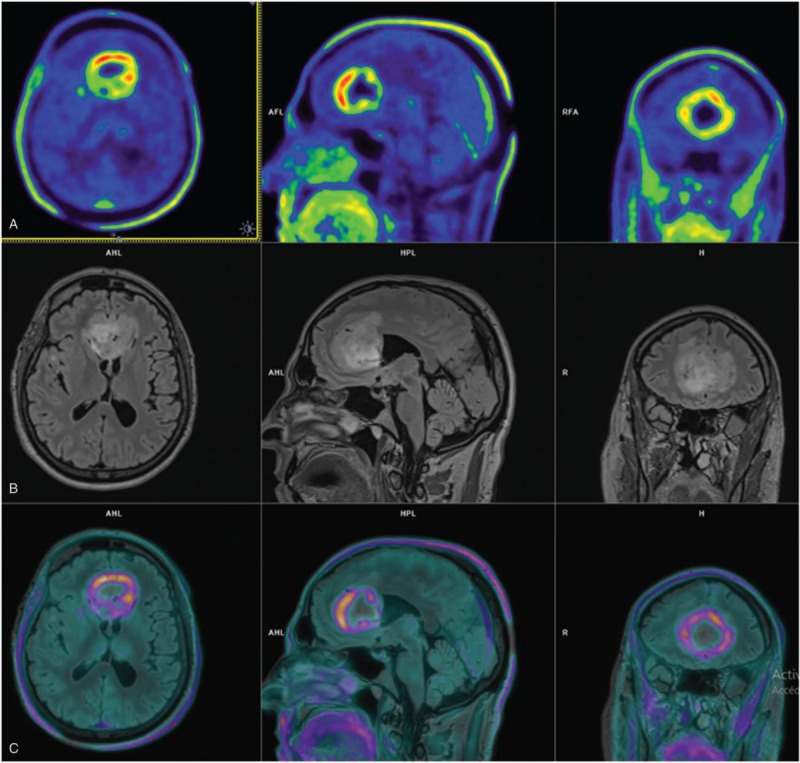
Figure 2.

Comparison of O-(2-[18F]fluoroethyl)-l-tyrosine positron-emission tomography (18F-FET PET) and T2 fluid attenuation inversion recovery (FLAIR) magnetic resonance images (MRIs) of 1 patient. (A) 18F-FET PET/computed tomography (CT) shows metabolically active bifrontal tumor mass. (B) MRI shows T2 FLAIR-hyperintense tumor and perifocal edema. (C) MRI and 18F-FET PET/CT image fusion reveal complementary information with inconsistent overlap of hypersignal in T2 and 18F-FET uptake.
