
Figure 2.
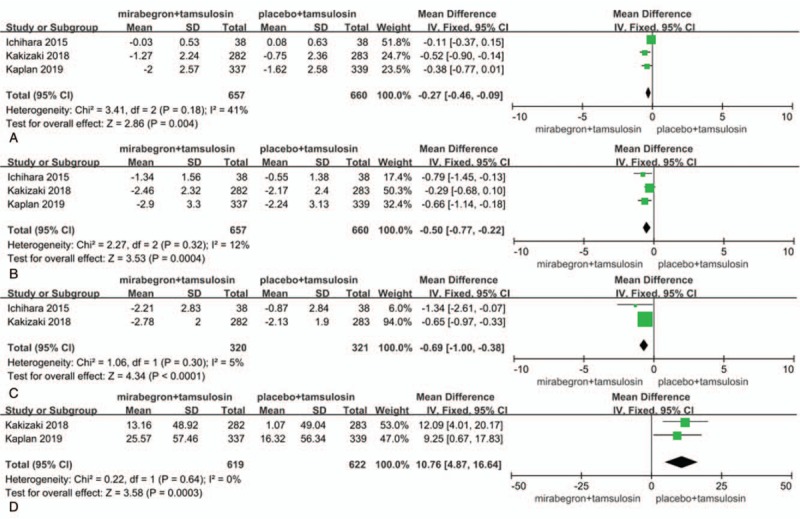
. Forest plots showing changes in (a) the mean number of micturitions per day, (b) the urgency episodes per day, (c) the total OAB symptom score (total OABSS), and (d) mean volume voided. CI = confidence interval, SD = standard deviation, IV = inverse variance.